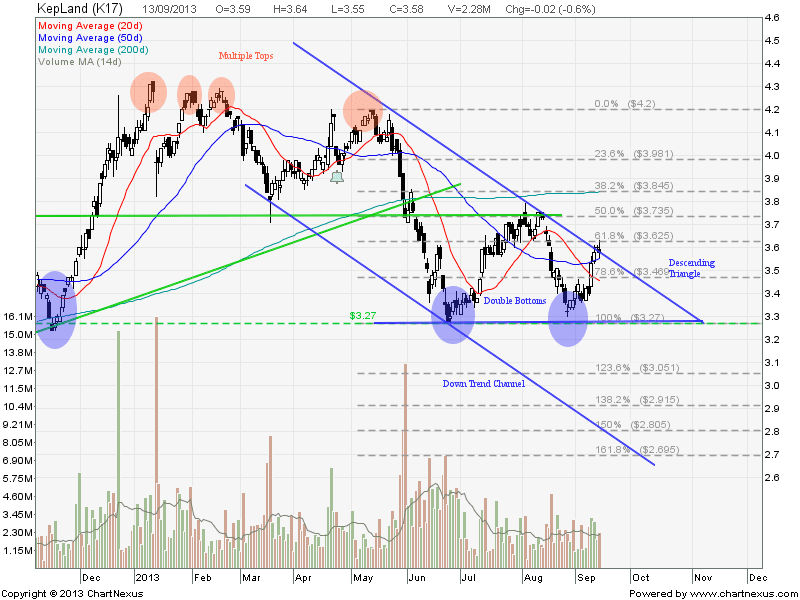
Keppel Land: Trading in either Sideway Consolidation or Down Side
There are a few chart patterns observed in Keppel Land Chart. Keppel Land is currently trading in a Descending Triangle (Range between $3.62 and $3.27). If $3.27 support is broken, Keppel Land will continue the fall in a Down Trend Channel with price target at about $2.70 (also the 161.8% Fibonacci Retracement Level).
Alternate scenario will be Keppel Land breaks the Triangle resistance at about $3.62 and $3.735 (neckline of Double Bottom), this pattern will confirm the trend reversal to upside.
Critical Level to watch:
- $3.27 Support
- $3.62 Resistance
Last Analysis on Keppel Land.