Citigroup (C): Buy on Dip?

  • Post author:

Citigroup retraced and found support at the uptrend channel support (also the 61.8% FR) at about $42.23. The stock is still trading in an uptrend. If there is no earning surprises on April 15, 2013, C should continue the uptrend. The next immediate resistance is $47.68. 161.8% Fibonacci Target is $56.16.

C Apr12-2013

Option Trade

  • Strategy: Long Vertical Call Spread (Bullish Trade)
  • Short C May13 45 Call, Long C May13 41 Call
  • Entry Price = $43.44
  • Breakeven Price = $43.43
  • Max Profit = $624
  • Max Loss = $976
  • Reward vs Risk = 64%

Previous Analysis on Citigroup C.

Continue ReadingCitigroup (C): Buy on Dip?

Bank of America (BAC): Double Tops at Sight!

  • Post author:

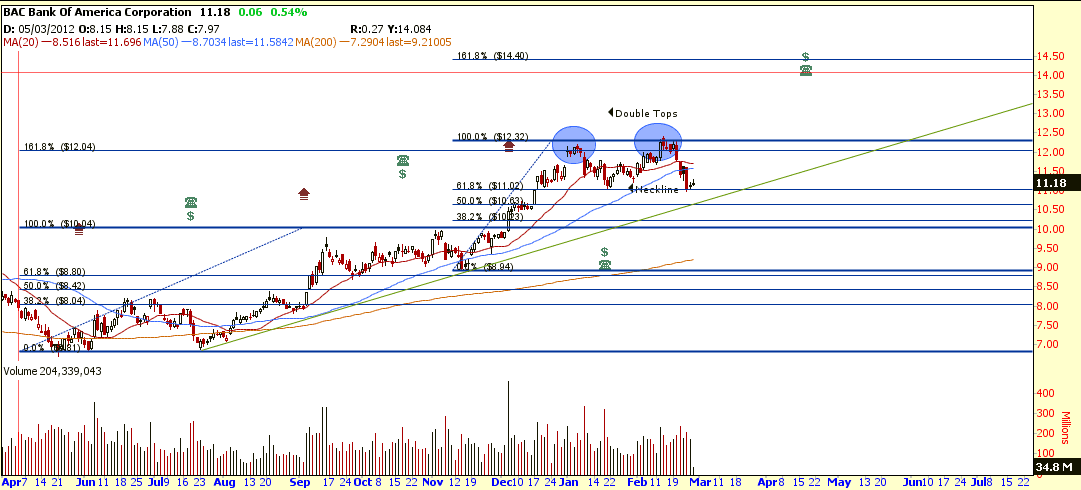
Bank of America (BAC) is forming a Double Tops with neckline at about $11.00. If BAC rebound from this neckline (also the 61.8% FR), BAC will continue the uptrend with price target of $14.40 (161.8% FR). If BAC break below $11.00 support, the price target of this Double Tops breakout is about $10.00

Key Statistics for BAC

Current P/E Ratio (ttm) 12.2033
Estimated P/E(12/2013) 11.2814
Relative P/E vs. SPX 0.8262
Earnings Per Share (USD) (ttm) 0.9200
Est. EPS (USD) (12/2013) 0.9950
Est. PEG Ratio 1.3017
Market Cap (M USD) 121,007.57
Shares Outstanding (M) 10,778.26
30 Day Average Volume 157,886,592
Price/Book (mrq) 0.5546
Price/Sale (ttm) 1.2045
Dividend Indicated Gross Yield 0.36%
Cash Dividend (USD) 0.0100
Last Dividend 02/27/2013
5 Year Dividend Growth -55.91%
Next Earnings Announcement 04/17/2013
Continue ReadingBank of America (BAC): Double Tops at Sight!