UOB Bank: Rejected at $20 Resistance

  • Post author:

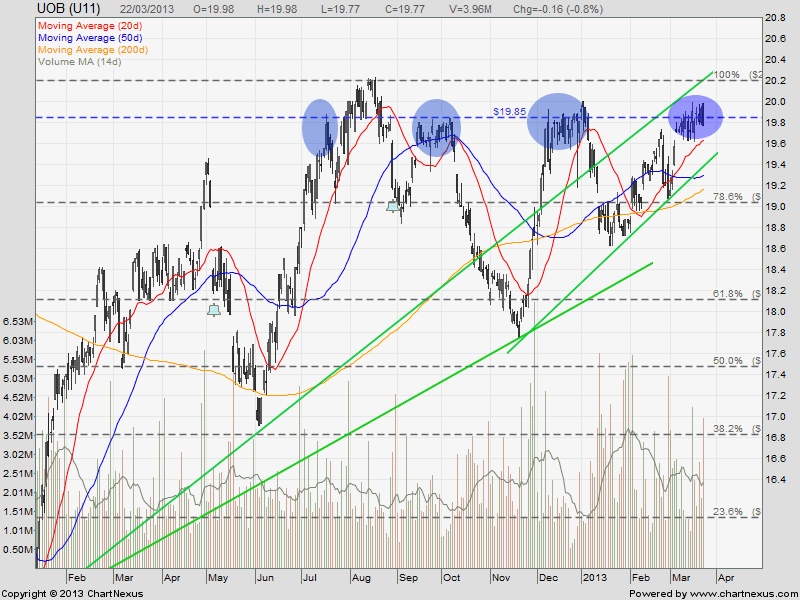
UOB rejected at $20.00 resistance with Bearish Engulfing pattern with a spike in trading volume. Is it a first sign of trend reversal? Anyway, I have shorted the stock using CFD base on my trading strategy “Buy Near Support, Sell Near Resistance” when I see a reversal candlestick pattern with a very tight stop loss just slightly above $20.00 resistance. All other technical indicators have not shown any bearish signals yet.

On a bigger scale, UOB is showing a Huge Ascending Triangle with a tough pyschological resistance at $20.00. 200D SMA support is at about $19.15.

Previous analysis on UOB Bank.

2013Mar23-UOB-800x600

Key Statistics for UOB

Current P/E Ratio (ttm) 11.5109
Estimated P/E(12/2013) 11.6775
Relative P/E vs. FSSTI 1.0717
Earnings Per Share (SGD) (ttm) 1.7175
Est. EPS (SGD) (12/2013) 1.6930
Est. PEG Ratio 1.3011
Market Cap (M SGD) 31,134.76
Shares Outstanding (M) 1,574.85
30 Day Average Volume 2,327,567
Price/Book (mrq) 1.3577
Price/Sale (ttm) 3.6342
Dividend Indicated Gross Yield 3.03%
Cash Dividend (SGD) 0.1000
Last Dividend 05/06/2013
5 Year Dividend Growth -5.09%
Next Earnings Announcement 05/09/2013
Continue ReadingUOB Bank: Rejected at $20 Resistance

Yangzijiang: Pull Back and Test 200D SMA

  • Post author:

Yangzijiang pull back to test the 200D SMA after rejected at $1.15 with a Bearish Engulfing candlestick pattern. If Yangzijiang can stay above $1.00 (also the 61.8% FR, Uptrend support & psychological resistance turned support), there is  good chance to continue the up trend. Current Yangzijiang is showing a “Higher High, Higher Low” uptrend pattern.

Things to watch:

  • Bullish candlestick pattern at this support level.
  • Clear $1.04 Gap resistance.
  • Whether can stay above $1.00. If not, next support is $0.97 (50% FR and 50D SMA)

Previous Analysis on Yangzijiang.

Yangzijiang falls after announcing warrants issue plan.

Continue ReadingYangzijiang: Pull Back and Test 200D SMA

Wilmar: Pulling Back Soon?

  • Post author:

Wilmar seems to be rejected at 200D SMA with a Bearish Engulfing candlestick pattern on daily chart. A Hanging Man is observed on weekly chart. Both candlestick pattern point to potential reversal in coming days. Opportunity to take profit for those who already have the position and buy on retracement for those who have missed the early boat.

On bullish side, Wilmar is forming a Bullish Pennant. So, also watch out a bullish breakout if retracement does not happen.

Continue ReadingWilmar: Pulling Back Soon?