NOL: Testing 200D MA Resistance

  • Post author:

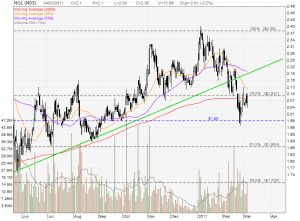
Current NOL chart looks bearish. A Bearish Engulfing candlestick pattern especially at the resistance level was observed. This is a reversal pattern after the recent rebounce. Keep a close eye that whether 20D MA crosses down the 200D MA in the next few days. If yes, NOL will start a bearish down trend.

Continue ReadingNOL: Testing 200D MA Resistance

Singapore Exchange (SGX): Trend Reversal

  • Post author:

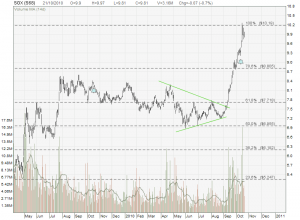
Singapore Exchange (SGX) has reached the price target of $9.20 after breaking out from the Falling Wedge pattern. A Bearish Engulfing candlestick patterns, which is a reversal pattern, was observed at about $10.00 (52 weeks high level).

Current PE of SGX is 31.77 which is considered over value.

Current Stock Price = $9.54

  • Rolling PE = 33.87
  • FY10 PE = 31.77
  • FY09 PE = 33.27
  • FY08 PE = 21.26
  • FY07 PE = 24.11

Technically and Fundamentally, SGX does not have enough strength to continue the bull run. A Trend Reversal is inevitable. Next crucial support at $8.805 (78.6% Fibonacci Retracement Level), followed by $7.718 (61.8% Fibonacci Retracement Level).

Continue ReadingSingapore Exchange (SGX): Trend Reversal

Genting Singapore: Trend Reversal!

  • Post author:

Genting Singapore shows a Bearish Engulfing candlestick pattern today. This is a trend reversal pattern after the recent uptrend.

Key level to watch:

  •  Whether Genting Singapore is still able to trade within this short term up trend channel, ie the channel support is not broken.
  • Whether Genting Singapore can bounce back when the stock reaches the 61.8% Fibonacci Retracement Level at about $1.126.

Continue ReadingGenting Singapore: Trend Reversal!