Sinotel Fundamental Analysis and Chart Pattern

  • Post author:

Sinotel Fundamental Analysis

  • Current Price = $0.335
  • IPO Price = $0.464
  • Current NAV = $0.365
  • Current PE = 4.57
  • Rolling PE = 4.64
  • FY08 PE =6.68
  • FY07 PE = 8.43
  • Dividend Yield = None
  • FY09 Net Profit Margin = 26.1%
  • FY09 ROA = 17.3%
  • FY09 ROE = 23.9%
  • FY09 Current Ratio = 3.34
  • FY09 Debt to Equity = 0.294

Sinotel Current Chart Pattern

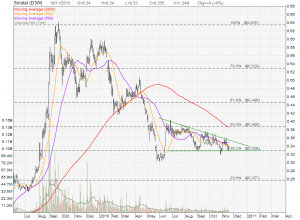
Sinotel is forming a Descending Triangle with the support at $0.329. Breaking below this support level will continue Sinotel down trend. Also take note that Sinotal is currently trading below 20D, 50D and 200D MA.

In Summary, Sinotel fundamental looks good and currently price is not overvalue comparing current & Rolling PE with the past PE.  As long as Sinotel can stay above $0.329, current level looks like a good entry level.

Continue ReadingSinotel Fundamental Analysis and Chart Pattern

Sinomem Fundamental Analysis and Chart Pattern

  • Post author:

Sinomem Fundamental Analysis

  • Current Price = $0.485
  • IPO Price = $0.44
  • Current NAV = $0.534
  • Current PE = 10.5
  • Rolling PE = 7.2
  • Dividend Yield = 2.06%
  • FY09 Net Profit Margin = 17.7%
  • FY09 ROA = 6.6%
  • FY09 ROE = 9.2%
  • FY09 Current Ratio = 2.16
  • FY09 Debt to Equity = 0.13

Sinomem Current Chart Pattern

 Sinomem is currently forming a Descending Triangle with a very strong support at $0.47 (which is also a 61.8% Fibonacci Retracement Support). Breaking below this support level will give a very bearish chart pattern for Sinomem. However, breaking out from this Descending Triangle will send Sinomem to minimum price target of $0.72. Base on current PE ratio, this stock is not over value.

Base on Fundamental & Chart Pattern Analysis, Sinomem is not for long term value investing but good for short term trading when breakout. This analysis base on my own stock selection criteria.

Continue ReadingSinomem Fundamental Analysis and Chart Pattern

Synear may start Down Trend

  • Post author:

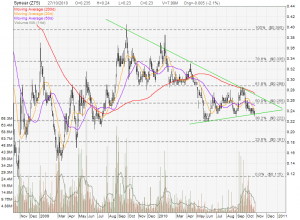
If Synear breaks the support at $0.222 (38.2% FR Level), a “Lower High, Lower Low” bearish down trend pattern will be seen on Synear. If Synear is able to hold above this support level, A Descending Triangle chart pattern may be formed and we just need to wait for the breakout to determine future trend. Take note that all three moving averages 20D, 50D and 200D MA are trending down.

Continue ReadingSynear may start Down Trend