Swiber: Breaking Out!
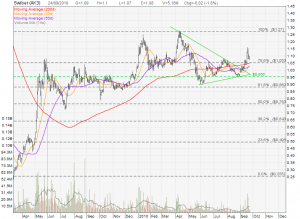
Follow up on Swiber last analysis. Swiber looks like breaking out from a Descending Triangle. Currently Swiber retraces back to test the support at the breakout point at about $1.05. This is a very important four-in-one support where 20D, 50D, 200D MA and 78.6% Fibonacci Retracement Level meet at this level.
Things to watch out for:
- Look for trend reversal candlesticks when rebound from this support level.
- If Swiber reverses and breaks the recent new high of $1.15, the breakout is successful and the price target is about $1.30.


