ST Engineering: Shooting Star, Doji, Hanging Man!
ST Engineering’s chart is SHOUTING at us! Shooting Star, Doji, Hanging Man!
Load your short gun!
See previous analysis on ST Engineering here.


ST Engineering’s chart is SHOUTING at us! Shooting Star, Doji, Hanging Man!
Load your short gun!
See previous analysis on ST Engineering here.
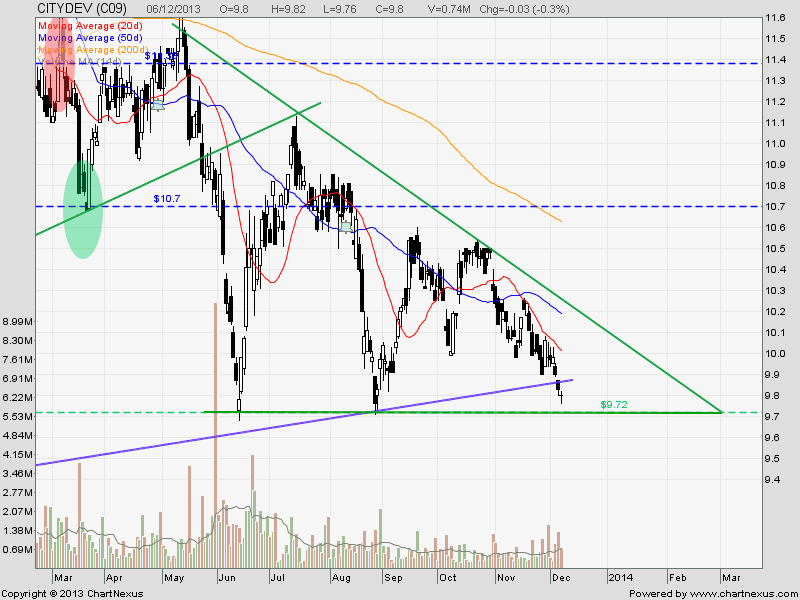
City Development showed a doji candle near the Descending Triangle support. Watch for reversal pattern for a quick long trade with price target $10.00-$10.20 (Triangle resistance). City Development chart is technically bearish. Keep stop loss tight.
See previous analysis on City Development.
| Current P/E Ratio (ttm) | 12.7604 |
|---|---|
| Estimated P/E(12/2013) | 15.3365 |
| Relative P/E vs. FSSTI | 0.9587 |
| Earnings Per Share (SGD) (ttm) | 0.7680 |
| Est. EPS (SGD) (12/2013) | 0.6390 |
| Est. PEG Ratio | 2.5171 |
| Market Cap (M SGD) | 8,911.15 |
| Shares Outstanding (M) | 909.30 |
| 30 Day Average Volume | 630,533 |
| Price/Book (mrq) | 1.2250 |
| Price/Sale (ttm) | 2.7217 |
| Dividend Indicated Gross Yield | 0.82% |
| Cash Dividend (SGD) | 0.0800 |
| Dividend Ex-Date | 08/13/2013 |
| 5 Year Dividend Growth | 0.98% |
| Next Earnings Announcement | 02/28/2014 |
Genting Singapore is currently testing a Tough Resistance at $2.03. This is the mid term down trend resistance, 50D MA resistance and 78.6% Fibonacci Resistance. Today Genting SP ended the trading day with a Doji, an indication of the end of the recent mini bull run. A potential reversal of trend at sight!
