Keppel Land: Trading in either Sideway Consolidation or Down Side

  • Post author:

There are a few chart patterns observed in Keppel Land Chart. Keppel Land is currently trading in a Descending Triangle (Range between $3.62 and $3.27). If $3.27 support is broken, Keppel Land will continue the fall in a Down Trend Channel with price target at about $2.70 (also the 161.8% Fibonacci Retracement Level).

Alternate scenario will be Keppel Land breaks the Triangle resistance at about $3.62 and $3.735 (neckline of Double Bottom), this pattern will confirm the trend reversal to upside.

Critical Level to watch:

  • $3.27 Support
  • $3.62 Resistance

Last Analysis on Keppel Land.

2013Sept13-KeppelLand

Continue ReadingKeppel Land: Trading in either Sideway Consolidation or Down Side

Midas: On Up Trend but wait for Pull Back

  • Post author:

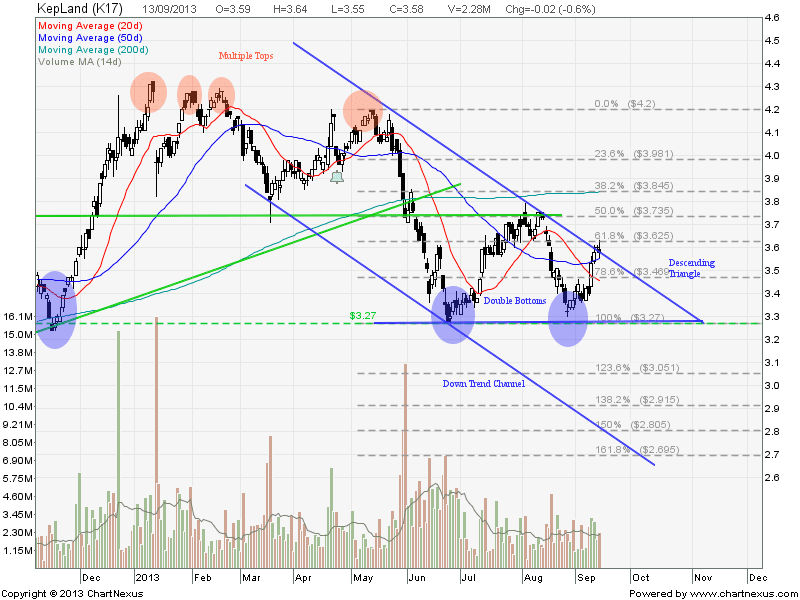
Midas is currently on a confirmed uptrend after rebounding from a Double Bottom (a trend reversal chart pattern). Midas is trading inside a Higher High, Higher Low, uptrend channel, and also above 20D, 50D and 200D SMA. However, Midas is over value base on PE ratio and PEG valuation. Midas is good for a bullish short term trade where there is a pull back near uptrend channel support.

Check out definition of PE & PEG valuation here.

Backgound:

Founded in 2000, Midas is today a leading manufacturer of aluminium alloy extrusion products and PE pipes, primarily for the transportation and infrastructure sectors in the PRC. The Group operates three business divisions; namely, Aluminium Alloy, PE Pipe and Agency and Procurement. Midas is the only PRC certified supplier to the world?s largest train manufacturers, ALSTOM SA, Siemens and Changchun Bombardier. The Group’s customers include a number of MNCs and PRC state-owned companies.

Key Statistics for MIDAS

Current P/E Ratio (ttm) 32.3933
Estimated P/E (12/2012 ) 46.8163
Earnings Per Share (CNY) (ttm) 0.0664
Est. EPS (CNY) (12/2012) 0.0460
Est. PEG Ratio 4.6353
Market Cap (M SGD) 511.40
Shares Outstanding (M) 1,217.62
Enterprise Value (M CNY) (ttm) 3,288.03
Enterprise Value/EBITDA (ttm) 12.04
Price/Book (mrq) 0.8825
Price/Sale (ttm) 2.8450
Dividend Indicated Gross Yield 1.79%
Next Earnings Announcement 11/14/2012
Continue ReadingMidas: On Up Trend but wait for Pull Back

Singapore Exchange (SGX): On Strong Up Trend

  • Post author:

Looks like Singapore Exchange (SGX) has bottomed up with clear uptrend. A Double Bottoms is in formation which is a reversal pattern with neckline at about $7.30. Currently SGX is trading above 20D, 50D and 200D SMA and trending up. 2/5 EMA is showing short term bullish signal on both daily and weekly chart. Good to buy on dip as long as 20D SMA support holds (strong support on past 3 occasions). Note: Base on current PE ratio and PEG valuation, SGX is not undervalue for long term value investing. Current chart is only suitable for short to medium term trade.


Key Statistics for SGX

Current P/E Ratio (ttm) 25.5857
Estimated P/E (06/2013 ) 23.1457
Earnings Per Share (SGD) (ttm) 0.2732
Est. EPS (SGD) (06/2013) 0.3020
Est. PEG Ratio 3.6739
Market Cap (M SGD) 7,465.89
Shares Outstanding (M) 1,068.08
Enterprise Value (M SGD) (ttm) 6,768.21
Enterprise Value/EBITDA (ttm) 18.35
Price/Book (mrq) 8.9920
Price/Sale (ttm) 11.5432
Dividend Indicated Gross Yield 3.86%
Next Earnings Announcement 10/17/2012
Continue ReadingSingapore Exchange (SGX): On Strong Up Trend