Venture Corp: Forming Double Bottoms

  • Post author:

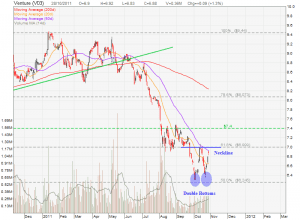
Venture is forming a Double Bottoms chart pattern with neckline at about $7.00. Price Target for this Double Bottom breakout is $7.60.  However, current candlestick pattern does not suggest the breakout soon as a Hanging Man was formed at the 50D MA resistance. If a bearish candle is form in the next trading day, an Evening Start candlestick pattern will be formed indicates a reversal to short term down trend again. Anyway, it is a good pattern to trade on Venture on either direction!

Continue ReadingVenture Corp: Forming Double Bottoms

HL Asia on Down Trend!

  • Post author:

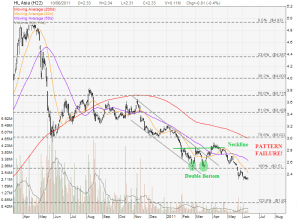
HL Asia has a Double Bottoms chart pattern failure. The stock was unable to break the neckline resistance and the stock price headed south since then. Currently HL Asia is trading below the 3 Moving Averages. Also take note that 200D MA (a long term trend) is sloping down which is a bearish sign.

Continue ReadingHL Asia on Down Trend!

Swiber: Starting Up Trend?

  • Post author:

Swiber is coming back to test the 20D/50D MA support and possibly the neckline of the Double Bottoms. If Swiber can stay above these supports, a “Lower High, Higher High” up trend pattern is formed but Swiber needs to clear the 61.8% Fibonacci Resistance at $0.88 first for the confirmation.

Continue ReadingSwiber: Starting Up Trend?