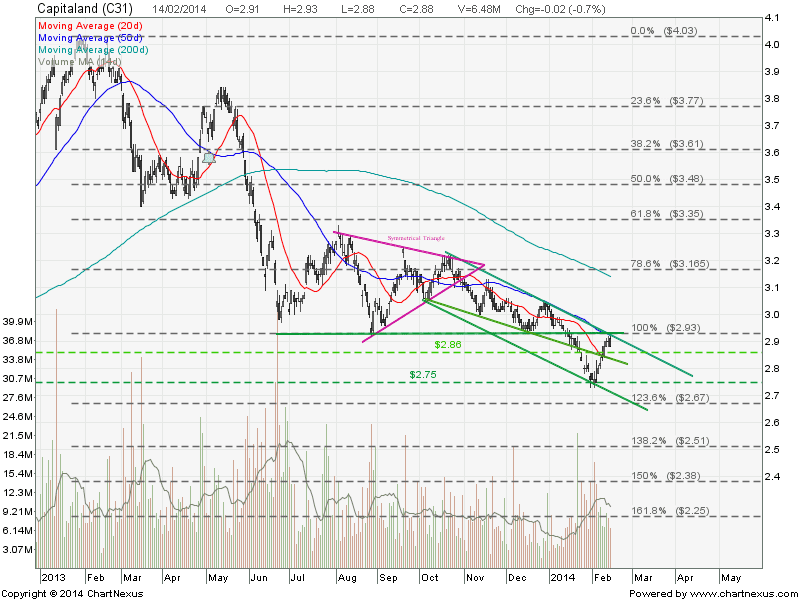
Capitaland: Dead Cat Bounce Finished?

  • Post author:

Capitaland was rejected at 50D SMA resistance with a Doji Bearish Engulfing. This resistance ($2.93) is the previous support turned resistance and also the Down Trend Channel Resistance. It looks like Capitaland will continue the down trend from here onwards. Technically Capitaland is on the down trend when 20D, 50D and 200D are all sloping down.

See other post for Capitaland fundamental data comparison with other property counters here.

2014Feb14-Capitaland-800x600

Continue ReadingCapitaland: Dead Cat Bounce Finished?

Wilmar: Dead Cat Bounce Finished?

  • Post author:

Wilmar rebounded after breaking down from a Head and Shoulders pattern. The stock is currently testing the down trend channel resistance with a Gravestone Doji. Also take note that Wilmar was rejected at the 200D SMA resistance. A good short candidate if there is a candle confirmation to end this Dead Cat Bounce.

2014Feb7-Wilmar

Original post by Marubozu from My Stocks Investing Journey.

Wilmar Fundamental Data

Current P/E Ratio (ttm) 11.4212
Estimated P/E(12/2013) 12.4878
Relative P/E vs. FSSTI 0.8925
Earnings Per Share (USD) (ttm) 0.2230
Est. EPS (USD) (12/2013) 0.2040
Est. PEG Ratio 1.2243
Market Cap (M SGD) 20,669.02
Shares Outstanding (M) 6,399.08
30 Day Average Volume 5,987,267
Price/Book (mrq) 1.1083
Price/Sale (ttm) 0.3695
Dividend Indicated Gross Yield 1.70%
Cash Dividend (SGD) 0.0250
Dividend Ex-Date 08/16/2013
5 Year Dividend Growth 0.37%
Next Earnings Announcement 02/20/2014

..

VALUATION RATIOS

Company Industry Sector
P/E Ratio (TTM) 11.26 23.60 34.34
P/E High – Last 5 Yrs. 21.22 15.11 30.64
P/E Low – Last 5 Yrs. 8.23 6.41 18.50

..

Continue ReadingWilmar: Dead Cat Bounce Finished?

SIA Engineering : Start Down Trend!

  • Post author:

SIA Engineering broke down from a Symmetrical Triangle and start a down trend now. The stock has a breakaway gap and currently trading below all 3 moving averages. Price Target for this breakout is $4.43. Immediate support turned resistance at $4.75 followed by $4.87 (Gap resistance & 61.8% FR).

Original post by Marubozu from My Stocks Investing Journey.

SIA Engineering Aug Feb6-2014

..

Current P/E Ratio (ttm) 19.5833
Estimated P/E(03/2014) 19.2623
Relative P/E vs. FSSTI 1.5459
Earnings Per Share (SGD) (ttm) 0.2400
Est. EPS (SGD) (03/2014) 0.2440
Est. PEG Ratio 3.6830
Market Cap (M SGD) 5,240.09
Shares Outstanding (M) 1,114.91
30 Day Average Volume 210,633
Price/Book (mrq) 4.0539
Price/Sale (ttm) 4.5345
Dividend Indicated Gross Yield 4.68%
Cash Dividend (SGD) 0.0700
Dividend Ex-Date 11/18/2013
5 Year Dividend Growth 0.93%
Next Earnings Announcement 05/14/2014

..

VALUATION RATIOS

Company Industry Sector
P/E Ratio (TTM) 20.01 19.55 1,069.42
P/E High – Last 5 Yrs. 19.50 104.50 43.62
P/E Low – Last 5 Yrs. 7.77 30.55 10.65
Continue ReadingSIA Engineering : Start Down Trend!