Monsanto (MON) Trade Idea

  • Post author:

Trading Strategy: Short Call Spread 100/110

  • Direction: Bearish
  • STO MON Aug 13 100 Call
  • BTO MON Aug 13 110 Call
  • If break down trend channel resistance (about $105), close both positions.
  • Breakeven Price: $103.80
  • Max Profit: $1149
  • Max Loss: $1851
  • Reward vs Risk: 0.62
  • Probability Price Below Breakeven: 74%

MON Chart

MON July26-2013

MON Fundamental

MON Fundamental Analysis July26-2013

Continue ReadingMonsanto (MON) Trade Idea

FTSE ST Real Estate Index: Elliott Wave B ended?

  • Post author:

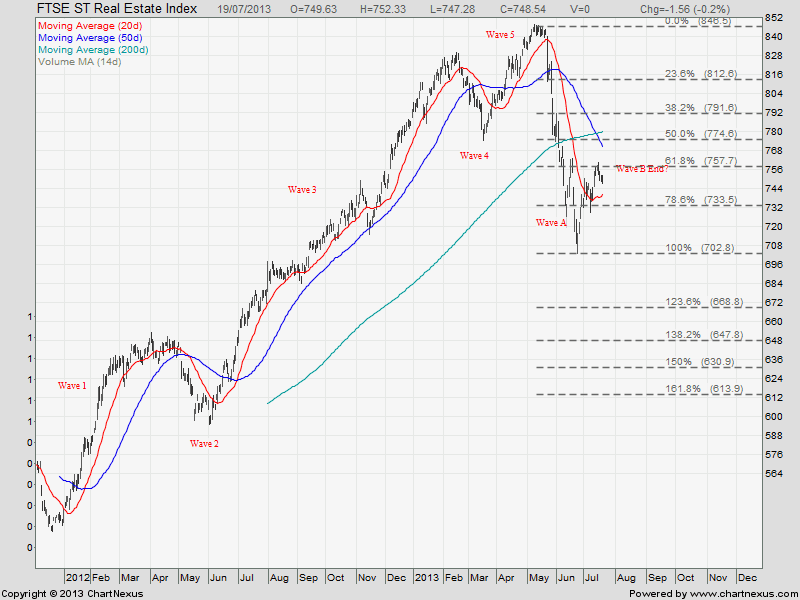
FTSE ST Real Estate is showing a Elliott Wave pattern. Currently the index is trading in a Wave B. Wave C (bearish wave) will start if the index break the support of 733.5. It is important to monitor the FTSE ST Real Estate Index because we can detect whether there is any strength or weakness in property counters to plan our trade.

Analysis by Marubozu https://mystocksinvesting.com

FTSE ST Real Estate Index July 21-2013

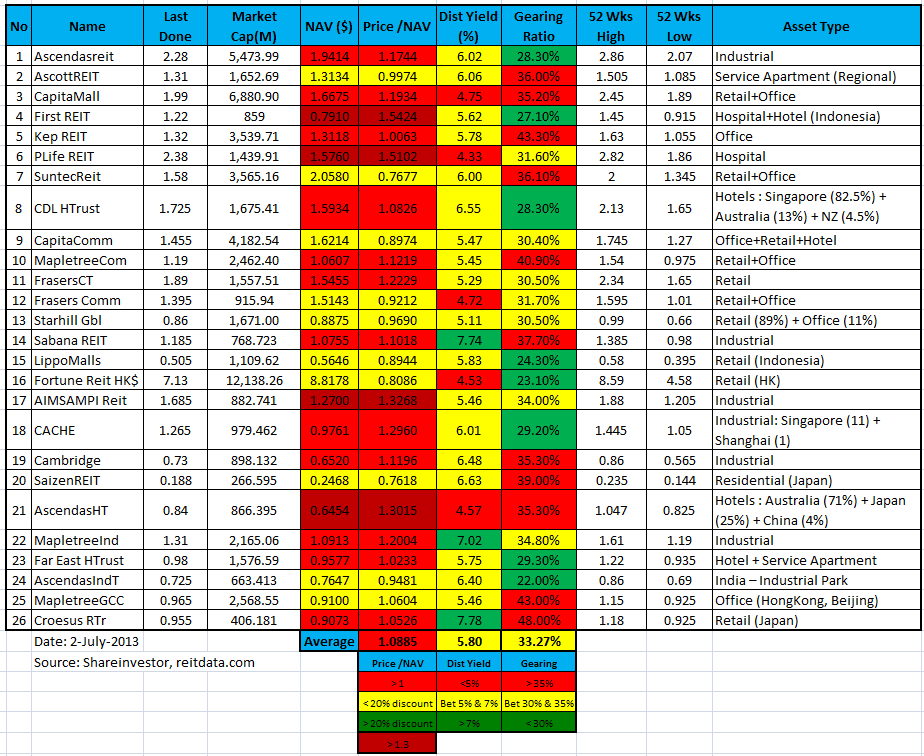
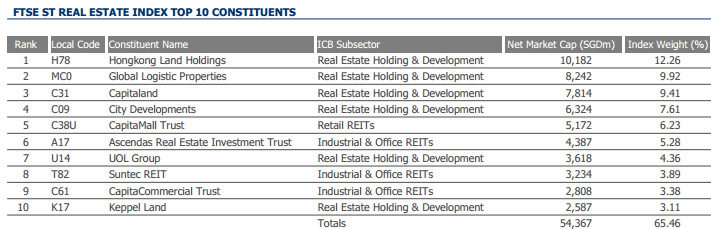
If the sector is weak, we can look for the Top 10 components stock to short by looking at the individual stock chart.

FTSE ST Real Estate Top 10 Companies

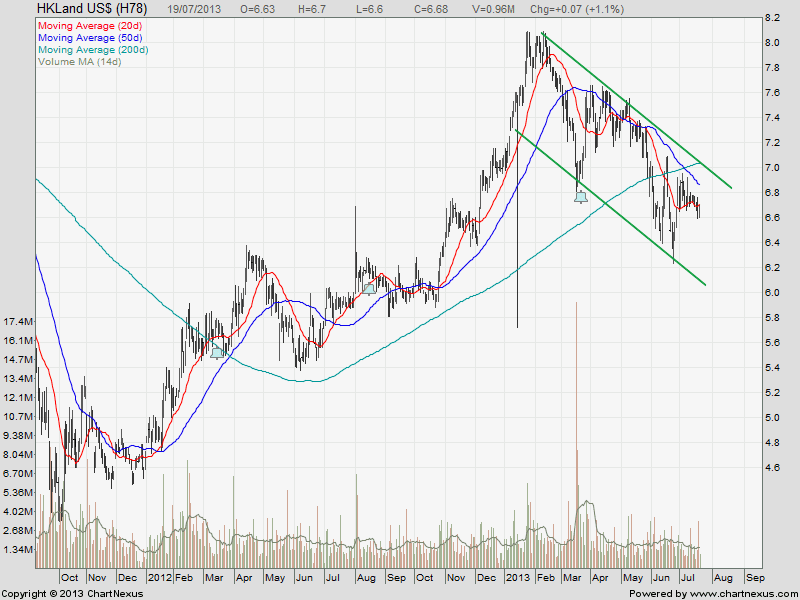
Look at Hongkong Land’s chart and you can see the weakness of the stock. The stock is trading in a down trend channel.

HK Land July21-2013

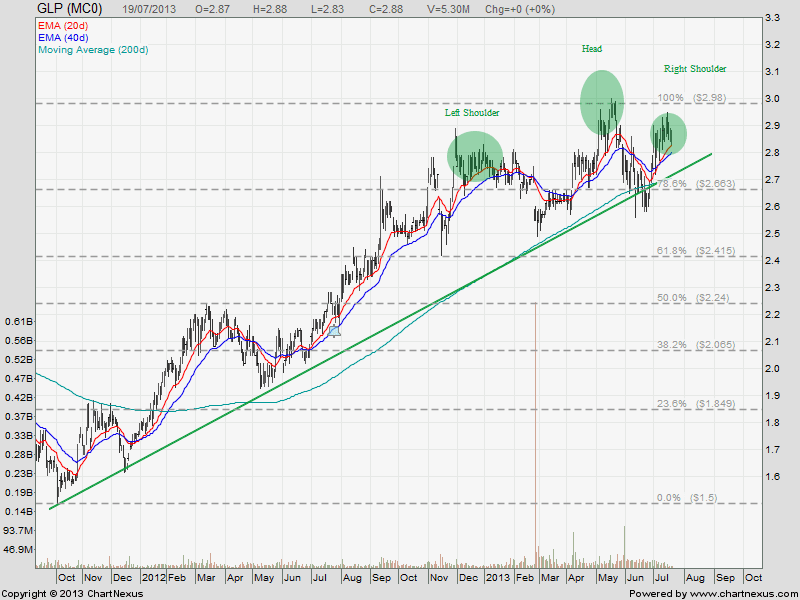
Although Global Logistic Properties (GLP) is still on uptrend but be cautious that a Head and Shoulders may be in formation.

2013July21-GLOBAL LOGISTIC PROP LIMITED-800x600

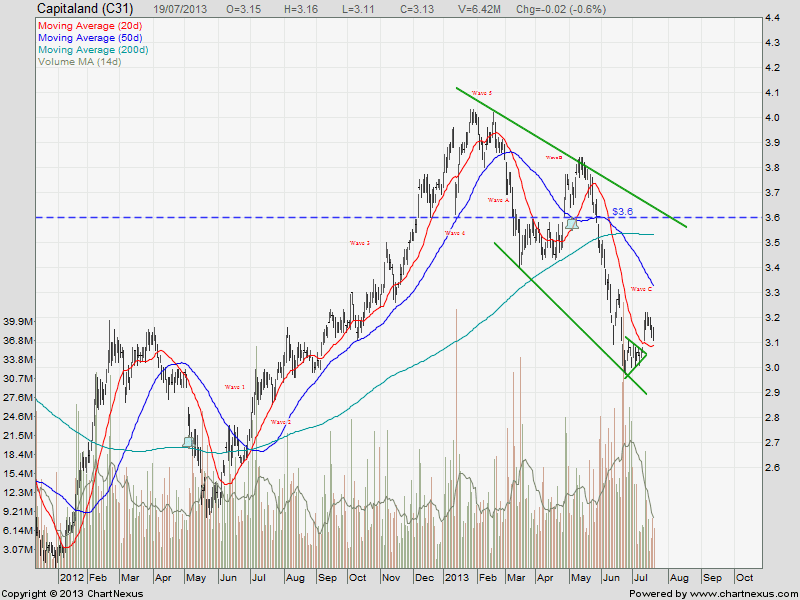
Capitaland’s chart is bearish and trading in down trend.

2013July21-Capitaland-800x600

Continue ReadingFTSE ST Real Estate Index: Elliott Wave B ended?

Singapore REITs Comparison Table for Dividend Investing as Passive Income – July 2013

  • Post author:

Technically Singapore REITs enter bear market because FTSE S-REIT Index has dropped below 200D SMA. Current FTSE S-REIT Index is 761.62 and trading in a down trend channel.FTSE ST REIT Index July2-2013

Compare to last month SREIT comparison table:

  • Price/NAV decreases from 1.12 to 1.09.
  • Dividend Yield increases from 5.6% to 5.8%
  • Gearing Ratio remain the same as 33.27%.

Singapore S-REIT stock comparison table 2July-2013

Doing Fundamental Analysis of Singapore REIT is relatively easier than stock. If you are interested to learn how to do research on Singapore REIT and also time the entry / exit by learning the simple Trend Analysis, you may want to check out my next public tutorial “How to pick Singapore REIT for Dividend Investing” .

Continue ReadingSingapore REITs Comparison Table for Dividend Investing as Passive Income – July 2013