Yanlord: Time to Take Profit

  • Post author:

Yanlord has been on bull trend for the past few months but it is time to take profit or reverse to short the stock after a Head and Shoulders, a reversal chart pattern is formed. Also take note that a “Lower Low, Lower High” down trend pattern started to show on Yanlord chart. Neckline support is at about $1.52.

Also take note that a Bullish Engulfing candlesticks was formed at the support indicate a possible rebound on next trading session. This presents good opportunity to short Yanlord on rebound.

Key Statistics for YLLG

Current P/E Ratio (ttm) 6.3179
Estimated P/E(12/2012) 14.8328
Relative P/E vs. FSSTI 0.6036
Earnings Per Share (CNY) (ttm) 1.2322
Est. EPS (CNY) (12/2012) 0.5250
Est. PEG Ratio 1.3363
Market Cap (M SGD) 3,010.80
Shares Outstanding (M) 1,948.74
30 Day Average Volume 4,685,900
Price/Book (mrq) 0.9669
Price/Sale (ttm) 1.4602
Dividend Indicated Gross Yield -%
Cash Dividend (SGD)
Last Dividend 05/16/2012
5 Year Dividend Growth
Next Earnings Announcement 02/28/2013
Continue ReadingYanlord: Time to Take Profit

Gold ETF (GLD): Bearish Down Trend!

  • Post author:

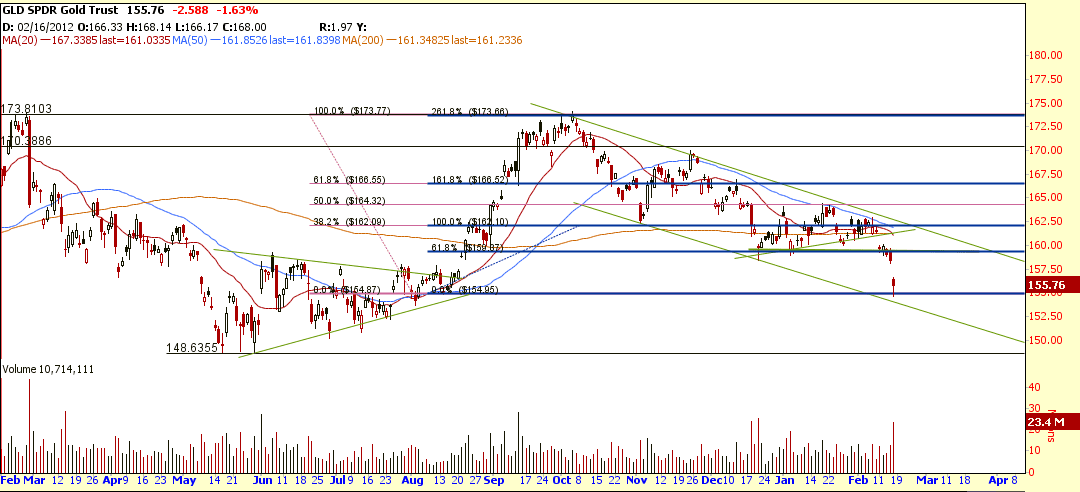
GLD has just broken down from a Symmetrical Triangle and currently trading in a down trend channel with breakout price target of $150. GLD is technically bearish as the ETF is trading below 20D, 50D and 200D SMA, and also trading in “Lower High, Lower Low” chart pattern.

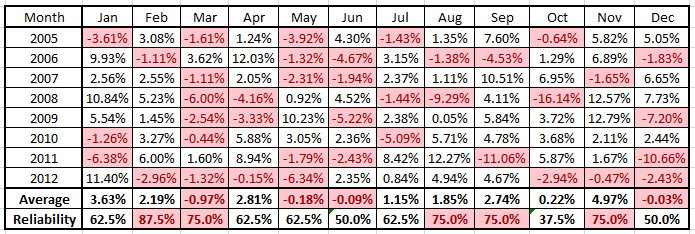
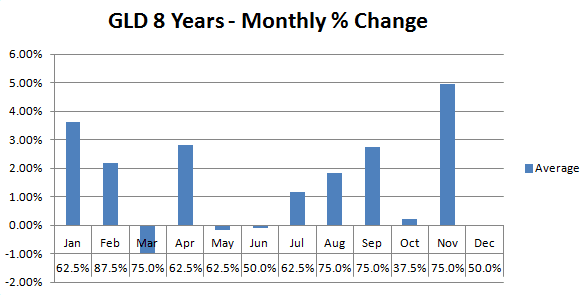
Traditionally GLD is bearish in the month of March base on past 8 years statistic with reliability of 75%. Base on chart pattern and past historical data, shorting GLD in Mar is a much higher probability trade than longing GLD.

There are a few ways to short Gold:
(1) Long Put Option on GLD
(2) Short Call Vertical Spread Option on GLD
(3) Long GLL (ProShares Ultrashort Gold ETF). – ProShares UltraShort Gold seeks daily investment results, before fees and expenses, that correspond to two times the inverse (-2x) of the daily performance of gold bullion as measured by the U.S. Dollar fixing price for delivery in London.


Continue ReadingGold ETF (GLD): Bearish Down Trend!

Singapore Exchange (SGX): Sideway Consolidation

  • Post author:

Singapore Exchange (SGX) is currently in consolidation mode and trading within a range between $6.94 & $7.05. Base on past chart pattern, 20D SMA proved to be reliable supports and resistances for SGX (shaded in Orange). Currently 20D SMA has catched up the stock price and provide a support at about $6.97. If history to be repeat itself on SGX, this stock should be breaking out from this consolidation phase soon provided 20D SMA is a good support again.

  • Immediate resistance is $7.05 followed by $7.28
  • Immediate support is about $6.95 (20D SMA) followed by $6.81 (61.8% FR)


Key Statistics for SGX

Current P/E Ratio (ttm) 26.8788
Estimated P/E(06/2013) 23.8435
Relative P/E vs. FSSTI 2.2171
Earnings Per Share (SGD) (ttm) 0.2608
Est. EPS (SGD) (06/2013) 0.2940
Est. PEG Ratio 3.2888
Market Cap (M SGD) 7,494.82
Shares Outstanding (M) 1,069.16
30 Day Average Volume 1,134,700
Price/Book (mrq) 10.5975
Price/Sale (ttm) 11.9139
Dividend Indicated Gross Yield 3.85%
Cash Dividend (SGD) 0.0400
Last Dividend 10/24/2012
5 Year Dividend Growth -6.11%
Next Earnings Announcement 01/22/2013
Continue ReadingSingapore Exchange (SGX): Sideway Consolidation