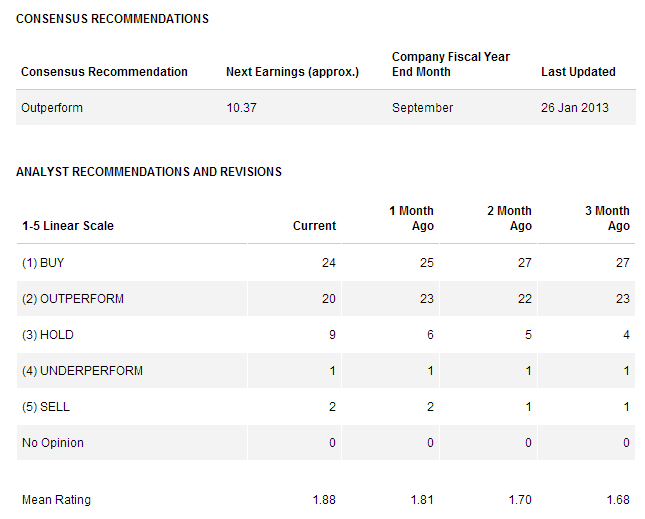
Don’t catch the falling knife although Apple (AAPL) is super under value now. Sarcastically most Analysts have a BUY or OVERWEIGHT call on AAPL but downgrade the target price. You are going to lose money if you just follow blindly the recommendation of the analysts. This is a classic example of combining Fundamental Analysis, Technical Analysis, Analyst Recommendation and the interpretation of Target Price, and develop a Trading Plan or Investment Plan.
Fundamental Analysis
- Last Traded Price = $439.88
- Current PE = 9.96
- Forward PE = 7.73
- PEG = 0.48
- P/B = 3.49
- Current Ratio = 1.50
- Debt / Equity = 0
- ROA = 28.54%
- ROE = 42.84%
Using DCF Valuation Method
- Intrinsic Value (7% annual growth rate for the next 10 years) = $713.54
- Intrinsic Value (12% annual growth rate for the next 10 years) = $918.80
- Operating Cash Flow = $56,728 Million
- No. of Shares Outstanding = 939.06 Million
- Beta = 1.08
- Discount Rate = 5%
- Debt per Share = 0
- Cash per Share = $42.40
Technical Analysis
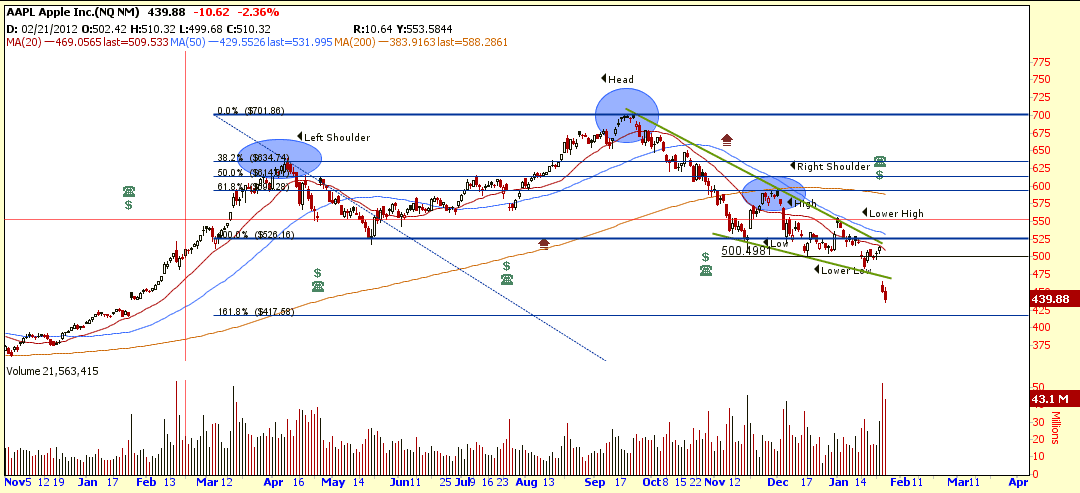
- AAPL breakdown from a Falling Wedge with Price Target of about $400 (short term).
- AAPL also breakdown from a Head & Shoulders with neckline at $525 and the price target is $350 (long term).
- Currently AAPL is trading down trend below 20D, 50D and 200D SMA.
Last Analysis on AAPL.
Last Intrinsic Calculation for AAPL.
Recent Upgrade / Downgrade
| 24-Jan-13 |
Reiterated |
UBS |
Buy |
$650 → $600 |
|
| 24-Jan-13 |
Reiterated |
RBC Capital Mkts |
Outperform |
$725 → $600 |
|
| 24-Jan-13 |
Reiterated |
Oppenheimer |
Outperform |
$800 → $600 |
|
| 24-Jan-13 |
Reiterated |
Mizuho |
Buy |
$600 → $575 |
|
| 24-Jan-13 |
Reiterated |
ISI Group |
Strong Buy |
$710 → $600 |
|
| 24-Jan-13 |
Reiterated |
Deutsche Bank |
Buy |
$800 → $575 |
|
| 24-Jan-13 |
Reiterated |
Barclays |
Overweight |
$740 → $575 |
|
| 23-Jan-13 |
Reiterated |
FBR Capital |
Outperform |
$725 → $675 |
|
| 22-Jan-13 |
Reiterated |
UBS |
Buy |
$700 → $650 |
|
| 22-Jan-13 |
Reiterated |
Monness Crespi & Hardt |
Buy |
$750 → $670 |
|
| 16-Jan-13 |
Reiterated |
Stifel Nicolaus |
Buy |
$825 → $725 |
|
| 07-Jan-13 |
Reiterated |
Barclays |
Overweight |
$800 → $740 |
|
| 21-Dec-12 |
Reiterated |
RBC Capital Mkts |
Outperform |
$750 → $725 |
|
| 17-Dec-12 |
Reiterated |
Mizuho |
Buy |
$750 → $600 |
|
| 17-Dec-12 |
Reiterated |
Canaccord Genuity |
Buy |
$800 → $750 |
|
| 14-Dec-12 |
Reiterated |
UBS |
Buy |
$780 → $700 |
|
Analyst Recommendation


