DBS Bank: Technicaly Bearish!
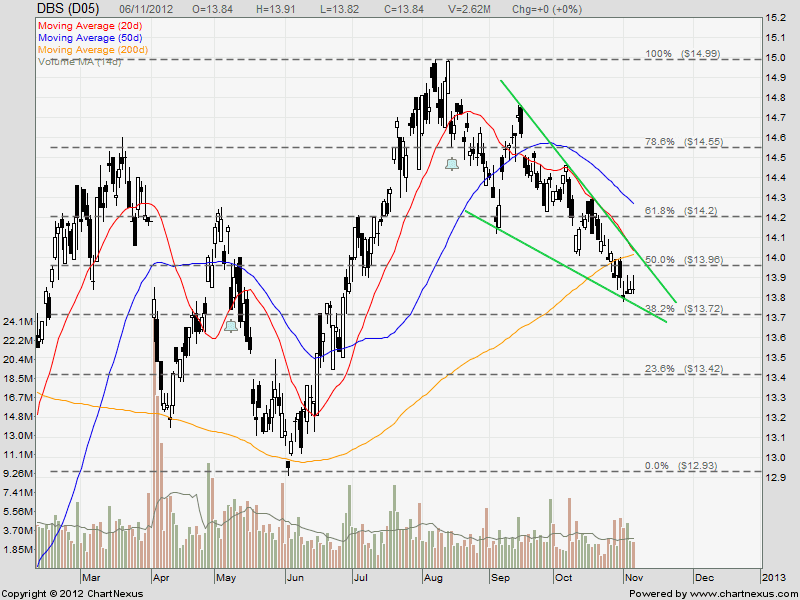
DBS Bank is forming a Falliing Wedge and is also technically bearish as the stock price is trading below 20D, 50D and 200D SMA. The 20D/200D SMA death cross is going to happen in next few days inevitably which is another bearish signal.
- Next Immediate Support: $13.72 (38.2% Fibonacci Retracement Level)
- Next Immediate Resistance: $14.00 (200D SMA, Falling Wedge Resistance & Psychological Resistance)
Key Statistics for DBS
| Current P/E Ratio (ttm) | 9.9467 |
|---|---|
| Estimated P/E(12/2012) | 9.8928 |
| Relative P/E vs.FSSTI | 0.8155 |
| Earnings Per Share (SGD) (ttm) | 1.3914 |
| Est. EPS (SGD) (12/2012) | 1.3990 |
| Est. PEG Ratio | 0.8678 |
| Market Cap (M SGD) | 33,721.57 |
| Shares Outstanding (M) | 2,436.53 |
| 30 Day Average Volume | 3,164,300 |
| Price/Book (mrq) | 1.1073 |
| Price/Sale (ttm) | 3.1827 |
| Dividend Indicated Gross Yield | 4.05% |
| Cash Dividend (SGD) | 0.2800 |
| Last Dividend | 08/15/2012 |
| 5 Year Dividend Growth | -0.58% |
| Next Earnings Announcement | 02/08/2013 |


