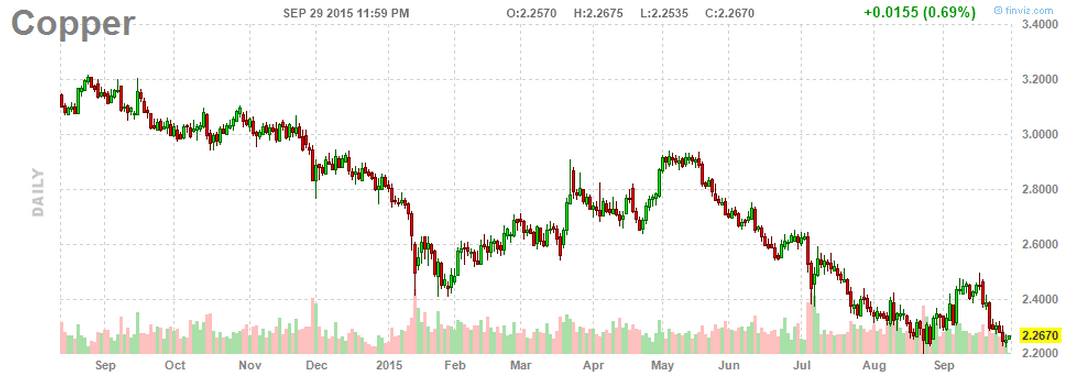
Copper: Hammer!
Copper has formed a Hammer at the support on daily chart. This is a potential reversal pattern for short term trade. Copper may be forming a Double Bottoms chart pattern after the recent down trend.
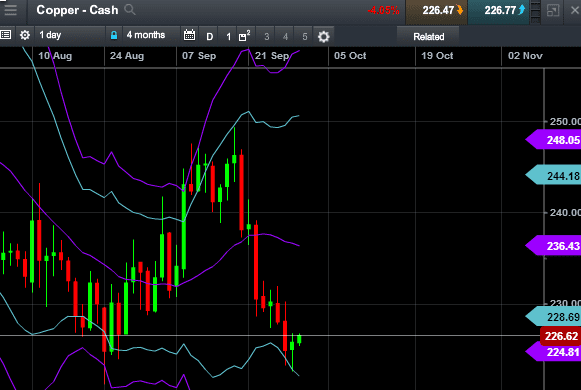

Copper has formed a Hammer at the support on daily chart. This is a potential reversal pattern for short term trade. Copper may be forming a Double Bottoms chart pattern after the recent down trend.
Capitaland rebounded from the 200D SMA support with confirmation after a hammer formation.
Capitaland is currently on an uptrend. Immediate resistance at $3.13 followed by $3.26.
See last post on the Property Sector Trend – FTSE ST Real Estate Index.

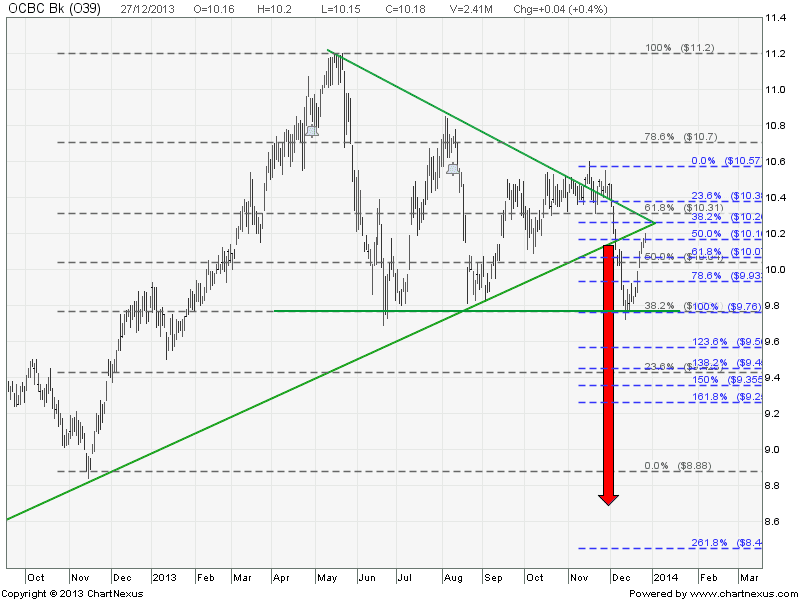
OCBC Bank has rebounded strongly after forming a Hammer at the Support. See previous analysis here. This Santa Claus Rally probably will continue for one more week with potential Window Dressing and Portfolio Pumping by the Fund Managers. So, watch for reversal candles when OCBC Bank get close to about $10.26 and $10.30. If the reversal does happen, the Symmetrical Triangle support will become resistance to confirm the successful breakout with price target of $8.70.
| Current P/E Ratio (ttm) | 13.4834 |
|---|---|
| Estimated P/E(12/2013) | 13.2208 |
| Relative P/E vs. FSSTI | 1.0052 |
| Earnings Per Share (SGD) (ttm) | 0.7550 |
| Est. EPS (SGD) (12/2013) | 0.7700 |
| Est. PEG Ratio | 2.2156 |
| Market Cap (M SGD) | 34,944.94 |
| Shares Outstanding (M) | 3,432.71 |
| 30 Day Average Volume | 3,590,167 |
| Price/Book (mrq) | 1.5837 |
| Price/Sale (ttm) | 4.1590 |
| Dividend Indicated Gross Yield | 3.34% |
| Cash Dividend (SGD) | 0.1700 |
| Dividend Ex-Date | 08/12/2013 |
| 5 Year Dividend Growth | 3.96% |
| Next Earnings Announcement | 02/14/2014 |