Apple (AAPL) Trade Idea

  • Post author:

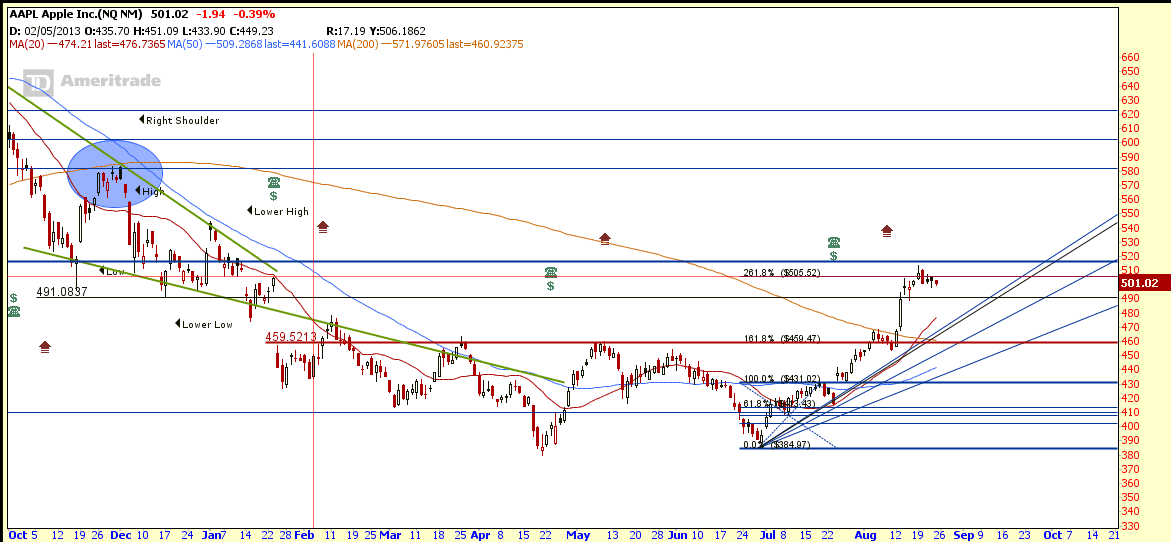
Chart Pattern: AAPL breakout from Inverted Head and Shoulders with neckline about $460. AAPL also broke the 200D SMA resistance and technically entered into bullish trend. The stock also retraced to retest the neckline support to confirm this is a successful breakout.

Trading Strategy: Short Put Spread.

  • Target Entry zone:
    • Scenario 1: $470-$480 when AAPL retraces back to Fibonacci Fan support. Currently AAPL is facing the 261.8% Fibonacci Resistance.
    • Scenario 2: If AAPL breakouts from current Bull Pennant / Bull Flag (above $510)
  • Scenario 1
    • STO AAPL Oct 13 480 Put
    • BTO AAPL Oct 13 470 Put
  • Scenario 2
    • STO AAPL Oct 13 510 Put
    • BTO AAPL Oct 13 500 Put
  • Minimum Price Target : $530 (Inverted Head and Shoulders Breakout Target)

AAPL Chart

AAPL Aug23-2013


AAPL Fundamental

AAPL Fundamental Aug23-2013

AAPL Intrinsic Value

  • Operating Cash Flow = $52,894 Million
  • No of Shares outstanding = 908.5 Million
  • Beta = 0.98
  • Discount Rate = 6%
  • No Growth (0% for next 10 years), IV = $443
  • Conservative Growth (5% for next 10 years), IV = $563
  • Moderate Growth (9% for next 10 years), IV = $709
  • Adjusted Growth Rate (12% for next 10 years). IV = $826


Chart from thinkorswim, get FREE chart here.

Original post by Marubozu from My Stocks Investing Journey.


Continue ReadingApple (AAPL) Trade Idea

Rotary Engineering: On Up Trend

  • Post author:

Rotary Engineering is currently trading within a Up Trend Channel after forming a “Higher High, Higher Low” pattern. The stock just rebounded from 61.8% FR level (also the neckline of Inverted Head and Shoulders) and clear the 200D SMA resistance. Price Target is about $0.60.

Next Earnings Announcement 02/28/2013

Previous analysis on Rotary Engineering breakout.

Continue ReadingRotary Engineering: On Up Trend

Yangzijiang: Breakout!

  • Post author:

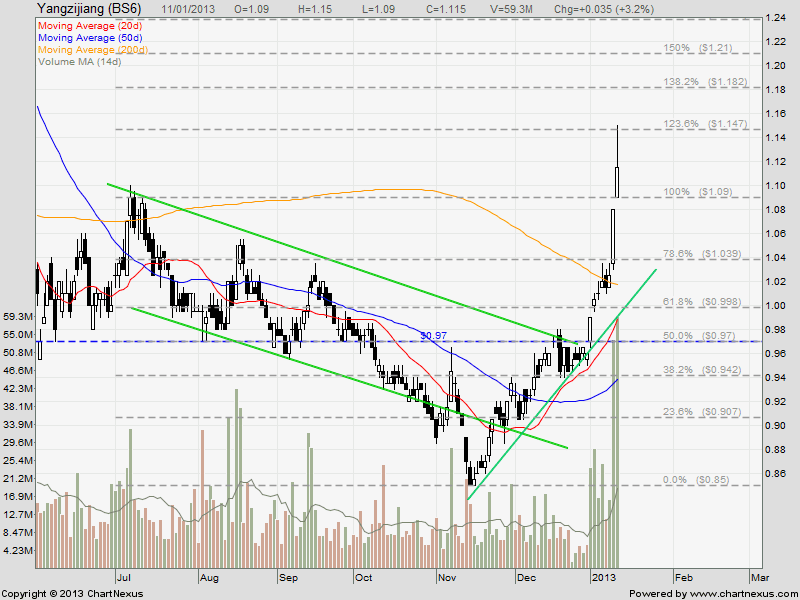
Yangzijiang breakout from a few key resistances:

  • Neckline of Inverted Head and Shoulders @$0.97
  • $1.00 psychological resistance
  • 200D SMA @ $1.00
  • 61.8% Fibonacci Retracement @ $1.00

This $1.00 is a very significant resistance for Yangzijiang. However the stock is rejected at $1.147 with long upper shadow indicates potential reversal. Anyway it is too late to chase the stock price, it is safer to wait for the retracement to test the $1.00 resistance turned support level.

By the way, it is not really a big surprise that big cap China stocks breakout and reverse to the uptrend. Those breakout are supported by the Fundamental of China Economy. Read my previous post of China Big Cap ETF (FXI) here.

Key Statistics for YZJ

Current P/E Ratio (ttm) 5.6940
Estimated P/E(12/2012) 6.1062
Relative P/E vs. FSSTI 0.4648
Earnings Per Share (CNY) (ttm) 0.9937
Est. EPS (CNY) (12/2012) 0.9270
Est. PEG Ratio
Market Cap (M SGD) 4,272.77
Shares Outstanding (M) 3,832.08
30 Day Average Volume 14,463,500
Price/Book (mrq) 1.4746
Price/Sale (ttm) 1.3167
Dividend Indicated Gross Yield 4.93%
Cash Dividend (SGD) 0.0550
Last Dividend 05/17/2012
5 Year Dividend Growth
Next Earnings Announcement 02/26/2013
Continue ReadingYangzijiang: Breakout!