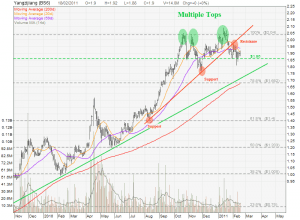
Commentary:
Both the S&P 500 and Dow Jones Industrial Average have confirmed the completion of a short-term topping pattern on October 23, falling below the price-swing lows of the last month. A double top, occurs when a rally is followed by a correction and the stock or index rallies back to the price level of the prior rally. The pattern is confirmed when the price once again retreats below the correction low, indicating a further slide in the price is likely. A multiple top is similar, except it will have three or more rallies to a similar price area, separated by corrections. The multiple-top pattern in the S&P 500 index is not large – from high to low it is 48.98 which provides a downside profit target of 1376.55. Multiple tops have also occurred in numbers stocks, with technical traders likely looking to take profits on long positions, or establish short positions.
AT&T, Inc (NYSE:T)

AT&T, Inc (NYSE:T), the telecom giant, completed a multiple-top formation in mid-October. The price peaked near $38.50 (high is $38.58) on multiple occasions between August and early October with the correction low between the peaks of $36.43. The topping pattern completed as the price dropped below that correction low. The height of the formation is $2.15 to $38.58 minus $36.43 and gives an estimate of the expected drop in price. Deduct $2.15 from the low of the formation, also called the breakout price, and the target is $34.28. The stock closed at $35 on October 23 which means the double-top profit target is in close proximity. There is a series of former price lows just above $34 though, so if the price falls below $34 it could trigger a bigger sell-off. A rise back above $38.58, while unlikely in the short term, would be bullish and negate and the multiple-top bearish pattern.
Arthur J Gallagher & Co. (NYSE:AJG)

The peaks of the multiple top formation in Arthur J Gallagher & Co. (NYSE:AJG) stock is less defined, with each peak moving to visibly different levels, but still in relatively close proximity to one another. Since August, each peak has been near $37, with two peaks in September making it to the $37.50 region (unadjusted for dividends). Two correction lows are of interest, the first being the August 31 low at $35.41. This level has already been breached and indicates a price slide to $33.36. The next important low is at $34.46, and represents a larger multiple topping pattern. If the price breaks that level, the target is $31.36. There is some upward trendline support intersecting near $35, therefore, if a rally can punch back above $37.56 it negates the bearish topping pattern.
BCE, Inc. (NYSE:BCE)

BCE, Inc. (NYSE:BCE) broke below the lows of a topping pattern on October 19. Once again, the price peaks did not reach the exact same levels, but areas of support and resistance are clearly defined. The high of $45.68 marked the high of price peaks and the formation, and $43.45 was the low. This gives a target of $41.22, but if that target is reached there’s little in the way of support until the $39.50 to $39 region. What will act as resistance on rallies will now be $43.50 to $44. If the stock pops back above $45.68 the bearish pattern is once again negated.
Avery Dennison Corp. (NYSE:AVY)

Avery Dennison Corp. (NYSE:AVY) is near a breakout point, but hasn’t broken out yet. Therefore, the pattern hasn’t actually completed but it is one that can be watched. Peaks in August and October at $32.30 mark the main highs of the pattern and $28.91 the low. If the low is penetrated, the target to the downside is $25.52. As of yet that has not occurred, and as long as the price stays between the aforementioned high and low price the stock is range bound. A rally above $32.30 negates the pattern and is likely to push the stock above the $32.78 52-week high.
Bottom Line:
The multiple top occurs quite often, but are often missed because the more tops that are present, the more and more it appears to be a ranging market. Because it is possible for a range to develop at any time, multiple tops are generally not traded by technical traders until a breakout has occurred. When the price drops below the correction low(s), that is the signal the chart pattern is in place and that a further slide in the price is likely. As with any strategy, it doesn’t work all the time, therefore always know and manage your risk.
Charts courtesy of stockcharts.com
At the time of writing, Cory Mitchell did not own shares in any of the companies mentioned in this article.


