SATS: Breakdown from Multiple Tops
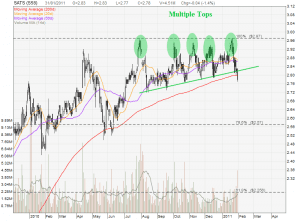
SATS has broken from the neckline support & 200D MA support today after forming a multiple tops with increase in selling trading volume. This is a bearish chart pattern and this breakdown may bring SATS to $2.57.
Important things to watch:
- Whether SATS can rebound from this 200D MA support and stay above $2.80.
- Whether this $2.80 turned support to resistance.
In summary, the current SATS charts look bearish, and downside risk is much higher than upside potential. $2.97 is a very tough resistance to break as SATS has failed the past 5 times.
- Current PE = 16.9
- Rolling PE = 16.2
- Dividend Yield = 4.6% (base on $2.78 stock price)
SATS is at fair value. This correction may be good for those who want to buy SATS at lower price to collect dividend.


