First Resources Fundamental Analysis
Business: First Resources Limited is one of the largest private sector producers of crude palm oil in Indonesia. Its primary business activities are cultivating oil palms, harvesting the fresh fruit bunches from those trees and processing crude palm oil and palm kernel which it sells in Indonesia and internationally.
- Current Price = $1.49
- Current NAV = $0.5867
- Current PE = 14.14 (At Fair Value)
- Rolling PE = 12.82
- Dividend Yield = 1.46% (Not interesting)
- FY09 Net Profit Margin = 51.4%
- FY09 ROA = 12.3%
- FY09 ROE = 21.9%
- FY09 Current Ratio = 3.6
- FY09 Debt to Equity = 0.4
First Resources Chart Analysis
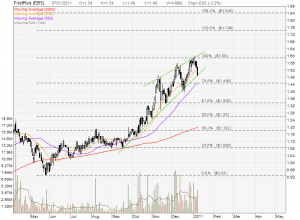
Currently First Resources is trading at close to 2 years high. The recent pull back to test the Rising Wedge support at about $1.48. If First Resources can hold this support level, the stock will face the next immediate resistance at $1.59. Rising Wedge chart pattern is normally a trend reversal pattern.

In Summary:
Fundamentally the stock looks good. Currently First Resources is trading at its fair value (PE close to 15). Coupled with a potential reversal base on the chart pattern, downside risk is higher than upside potential. First Resources should be kept under watch list and wait for pull back to accumulate for medium to long term investing for capital gain but not for dividend.


