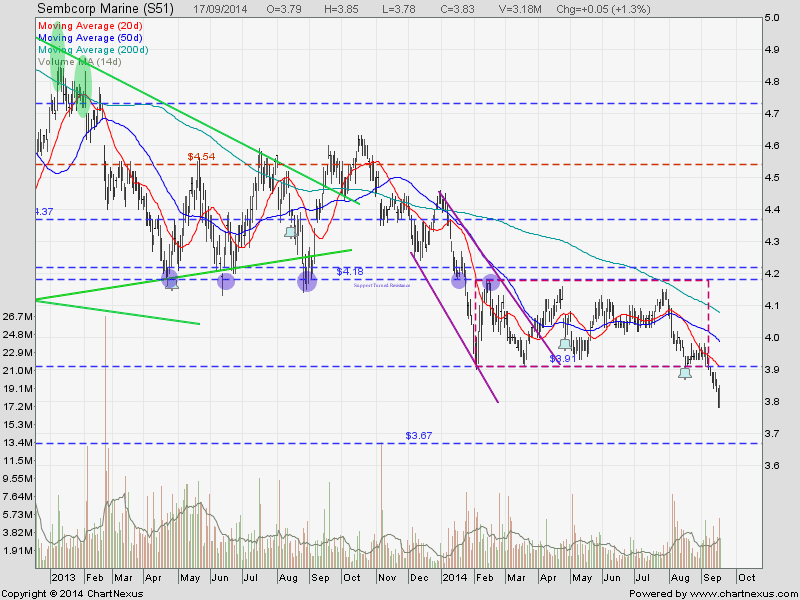
Sembcorp Marine: Official Down Trend
Sembcorp Marine is officially on Down Trend (Lower High, Lower Low has been formed) after breaking down of a Rectangle pattern and trade below all the 3 moving averages. Price target for this breakdown is $3.67. Currently Sembcorp Marine may rebound to test $3.91 to see whether this level can become a support turned resistance level.
Original Post by Marubozu My Stocks Investing Journey
| Current P/E Ratio (ttm) | 14.1276 |
|---|---|
| Estimated P/E(12/2014) | 13.6786 |
| Relative P/E vs. FSSTI | 1.0338 |
| Earnings Per Share (SGD) (ttm) | 0.2711 |
| Est. EPS (SGD) (12/2014) | 0.2800 |
| Est. PEG Ratio | 1.2724 |
| Market Cap (M SGD) | 8,001.89 |
| Shares Outstanding (M) | 2,089.27 |
| 30 Day Average Volume | 3,084,967 |
| Price/Book (mrq) | 2.8945 |
| Price/Sale (ttm) | 1.3272 |
| Dividend Indicated Gross Yield | 2.87% |
| Cash Dividend (SGD) | 0.0500 |
| Dividend Ex-Date | 08/15/2014 |
| 5 Year Dividend Growth | 3.40% |
| Next Earnings Announcement | 11/05/2014 |