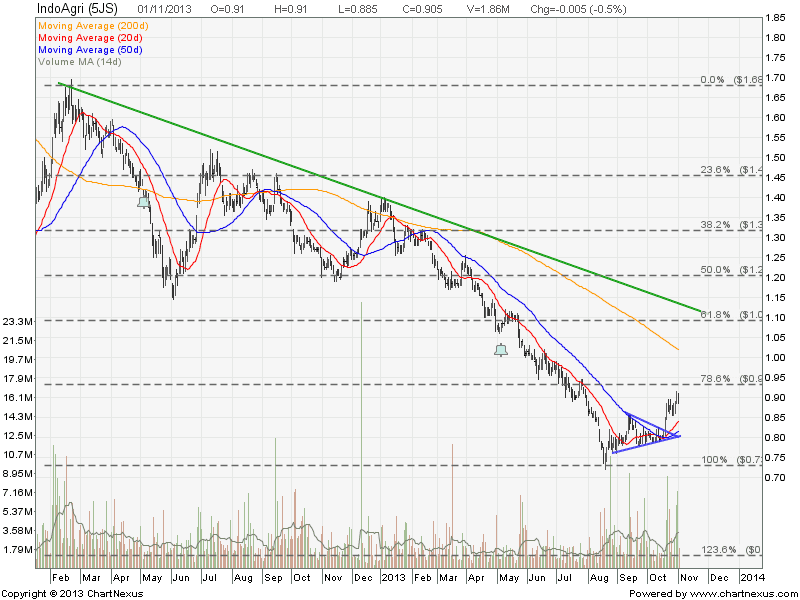
IndoAgri: Short Term Rebound
IndoAgri has bottomed out and stopped the down trend. Currently the stock on the short term uptrend after breaking out from a Symmetrical Triangle. Immediate resistance is at about $1.00 (200D SMA) followed by $1.10 (long term down trend resistance). Immediate support at $0.85.
Trend:
- Short & Medium Up Trend.
- Long Term Down Trend.
Key Statistics for IFAR
| Current P/E Ratio (ttm) | 25.8895 |
|---|---|
| Estimated P/E(12/2013) | 23.8947 |
| Relative P/E vs. FSSTI | 1.8846 |
| Earnings Per Share (IDR) (ttm) | 319.0000 |
| Est. EPS (IDR) (12/2013) | 345.6300 |
| Est. PEG Ratio | – |
| Market Cap (M SGD) | 1,282.64 |
| Shares Outstanding (M) | 1,417.28 |
| 30 Day Average Volume | 2,899,500 |
| Price/Book (mrq) | 0.8367 |
| Price/Sale (ttm) | 0.9185 |
| Dividend Indicated Gross Yield | 0.94% |
| Cash Dividend (SGD) | 0.0085 |
| Dividend Ex-Date | 05/06/2013 |
| 5 Year Dividend Growth | – |
| Next Earnings Announcement | 02/27/2014 |
Original Post by Marubozu @ My Stocks Investing Journey.