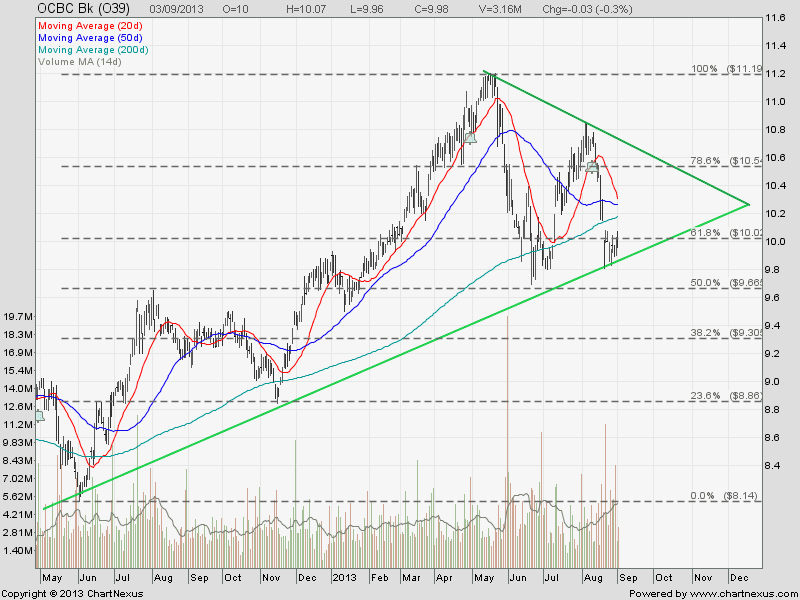
OCBC Bank: Consolidating in a Symmetrical Triangle
OCBC Bank is currently consolidating in a Symmetrical Triangle and trading just above the Triangle Support. Expect rebound at current level to the Triangle resistance at about $10.50-$10.60.
Original post by Marubozu https://mystocksinvesting.com
Key Statistics for OCBC
| Current P/E Ratio (ttm) | 9.3389 |
|---|---|
| Estimated P/E(12/2013) | 13.1455 |
| Relative P/E vs. FSSTI | 0.7431 |
| Earnings Per Share (SGD) (ttm) | 1.0740 |
| Est. EPS (SGD) (12/2013) | 0.7630 |
| Est. PEG Ratio | 2.4196 |
| Market Cap (M SGD) | 34,437.33 |
| Shares Outstanding (M) | 3,433.43 |
| 30 Day Average Volume | 4,124,400 |
| Price/Book (mrq) | 1.4845 |
| Price/Sale (ttm) | 4.1289 |
| Dividend Indicated Gross Yield | 3.39% |
| Cash Dividend (SGD) | 0.1700 |
| Last Dividend | 08/12/2013 |
| 5 Year Dividend Growth | 3.96% |
| Next Earnings Announcement | 11/08/2013 |