DBS Bank: Shooting Star @ Support Turned Resistance

  • Post author:

DBS Bank is showing a Shooting Star at the Support Turned Resistance at $16.14. Wait for the next candle to confirm the reversal. A good trading opportunity but need to get out before the XD date and earning release.

2014 Mar25-DBS

See previous analysis on DBS bank here. The symmetrical triangle breakout pattern with price target still valid.

Current P/E Ratio (ttm) 10.6411
Estimated P/E(12/2014) 10.4224
Relative P/E vs. FSSTI 0.7865
Earnings Per Share (SGD) (ttm) 1.5074
Est. EPS (SGD) (12/2014) 1.5390
Est. PEG Ratio 4.6322
Market Cap (M SGD) 39,241.67
Shares Outstanding (M) 2,446.49
30 Day Average Volume 4,446,067
Price/Book (mrq) 1.1732
Price/Sale (ttm) 3.3377
Dividend Indicated Gross Yield 3.62%
Cash Dividend (SGD) 0.3000
Dividend Ex-Date 05/12/2014
5 Year Dividend Growth -4.08%
Next Earnings Announcement 04/30/2014
Continue ReadingDBS Bank: Shooting Star @ Support Turned Resistance

SIA Engineering: Dead Cat Bounce Completed?

  • Post author:

Looks like the recent Dead Cat Bounce has completed for SIA Engineering after the stock price rejected 3 times at 200D SMA resistance (also the support turned resistance of the Symmetrical Triangle). In addition, there is also a Price Volume Divergence during this rebound. SIA Engineering shall continue to trade in a down trend channel towards the breakout price target of a Symmetrical Triangle of $4.43.

See previous stock chart analysis of SIA Engineering here.

SIA Engineering Mar12-2014

Continue ReadingSIA Engineering: Dead Cat Bounce Completed?

ST Engineering: Respect the 50D SMA

  • Post author:

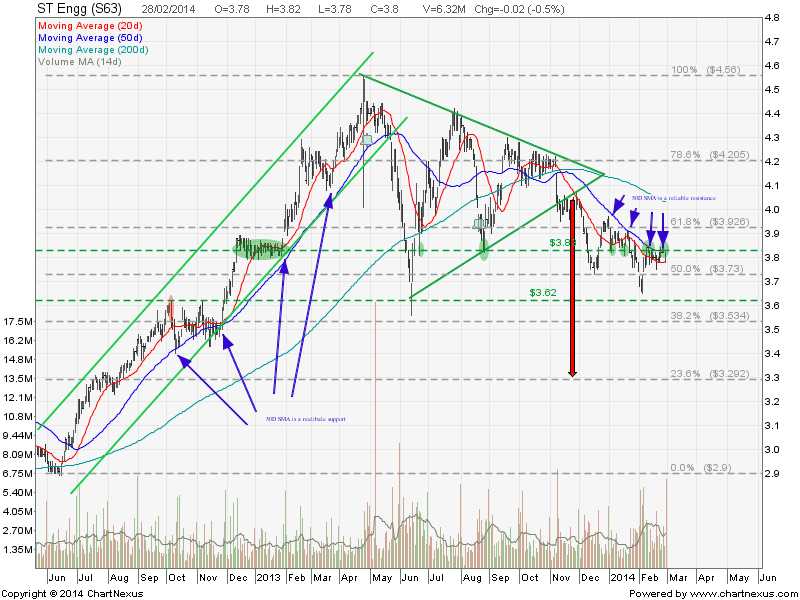
ST Engineering is currently trading in down trend and in short term consolidation. More down side expected in the coming days or weeks as ST Engineering was rejected at $3.83 support turned resistance (green) and also the 50D SMA resistance (blue). 50D SMA is rather reliable as support & resistance for ST Engineering when the stock is trending. The price target of the Symmetrical Triangle breakout is still valid. See previous stock chart  analysis for ST Engineering here.

2014Mar1-ST Engg-800x600

Join the Technical Analysis Workshop to learn how to derive the target price of the chart pattern of Symmetrical Triangle and learn how to identify a reliable support & resistance level to increase the probability of winning in your trade.

Continue ReadingST Engineering: Respect the 50D SMA