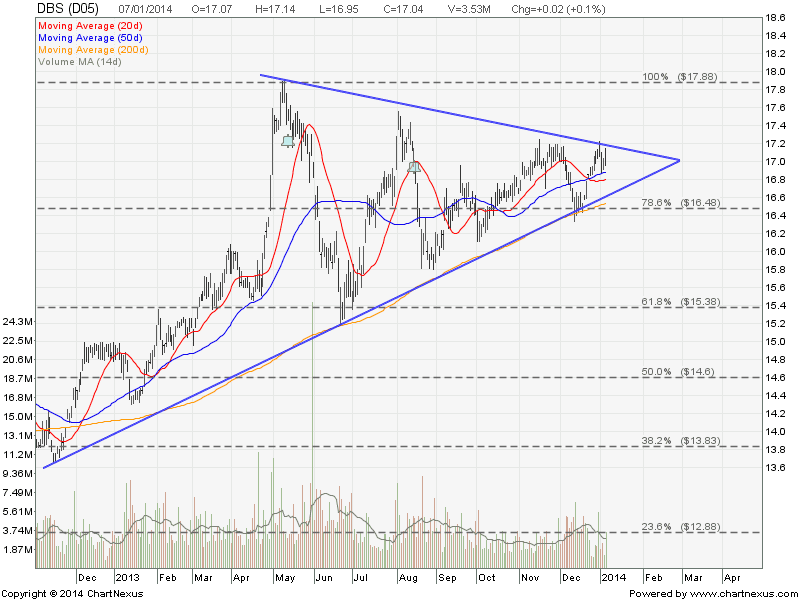
DBS Bank: Trading in a Symmetrical Triangle
DBS Bank is currently trading in a Symmetrical Triangle and testing the Triangle resistance. DBS will be trading within the range of $16.50 and $17.20 until a breakout.
Original post by Marubozu @ My Stocks Investing Journey.
| Current P/E Ratio (ttm) | 10.6062 |
|---|---|
| Estimated P/E(12/2013) | 11.7033 |
| Relative P/E vs. FSSTI | 0.7975 |
| Earnings Per Share (SGD) (ttm) | 1.6066 |
| Est. EPS (SGD) (12/2013) | 1.4560 |
| Est. PEG Ratio | 2.3290 |
| Market Cap (M SGD) | 41,667.63 |
| Shares Outstanding (M) | 2,445.28 |
| 30 Day Average Volume | 3,316,467 |
| Price/Book (mrq) | 1.2855 |
| Price/Sale (ttm) | 3.6677 |
| Dividend Indicated Gross Yield | 3.29% |
| Cash Dividend (SGD) | 0.2800 |
| Dividend Ex-Date | 08/15/2013 |
| 5 Year Dividend Growth | -4.08% |
| Next Earnings Announcement | 02/06/2014 |