US Market Indices Review: Dow Jones Industrial, S&P500, NASDAQ – THE RETURN OF THE BEAR?

  • Post author:

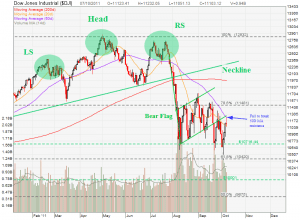
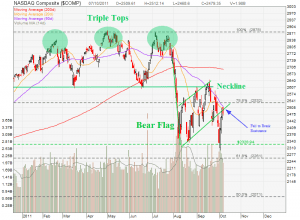
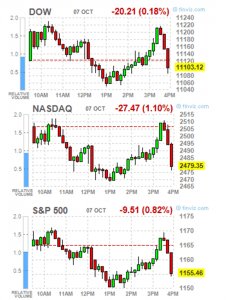
All 3 US Key Indices Dow Jones Industrial, S&P500 and NASDAQ Composite faced sell off in the last 30 mins of trading hour. This is not really unexpected because I am predicting the stock market will turn to bear again after the recent 3 days strong rally because they are hitting the resistance. Fasten your seat beat in the coming week because I am anticipating another Bear Flag, ie. another big sell off!



Continue ReadingUS Market Indices Review: Dow Jones Industrial, S&P500, NASDAQ – THE RETURN OF THE BEAR?

US Market Indices Review: Dow Jones Industrial, S&P500, NASDAQ

  • Post author:

Stock market staged an impressive rally last week with NO BAD NEWS. Is this the return of the Bull market? Base on the chart pattern, it looks like a Bear Market Rally as all 3 US indices Dow Jones Industrial, S&P500 and NASDAQ are forming a Bear Flag chart pattern. Both Dow Jones Industrial ($DIJ) and S&P500 ($SPX) are getting near the Flag Resistance and the 50D MA resistance, whereas NASDAQ has reached the Flag Resistance and the Triple Tops neckline. Watch out for the potential trend reversal pattern in the coming few days. Another scenario will be all 3 Indices break the Flag Resistance and 50D MA resistance. The Bull may return if this scenario happens.


Previous Analysis on Dow Jones Industrial, S&P500 and NASDAQ.

Continue ReadingUS Market Indices Review: Dow Jones Industrial, S&P500, NASDAQ

US Market Indices Review: Dow Jones Industrial, S&P500, NASDAQ

  • Post author:

 
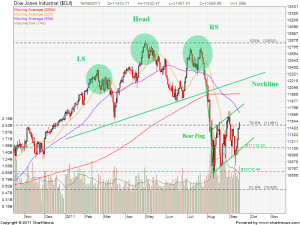
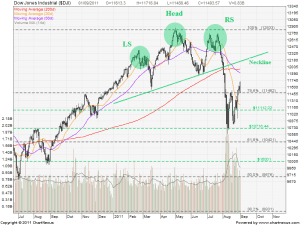
Dow Jones Industrial ($DJI)

  • Chart Pattern: Head and Shoulders (Bearish)
  • Resistances: 11,900 (50D MA); 12,000 (200D MA)
  • Supports: 11,482 (78.6% Fibonacci Retracement Level); 11,230 (20D MA)
  • Trend: Start of Down Trend.


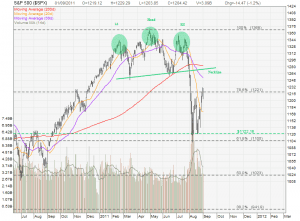
S&P500 ($SPX)

  • Chart Pattern: Head and Shoulders (Bearish)
  • Resistances: 1,221 (78.6% Fibonacci Retracement Level); 1,254(50D MA); 1,275 (Neckline and 200D MA)
  • Supports: 1,172 (20D MA); 1,122; 1105 (61.8% Fibonacci Retracement Level)
  • Trend: Start of Down Trend.

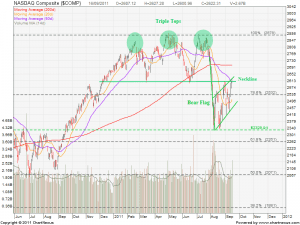
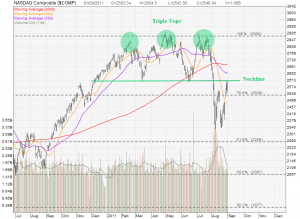
NASDAQ Composite ($COMP)

  • Chart Pattern: Triple Tops (Bearish)
  • Resistances: 2,606 (Neckline); 2,655 (50D MA); 2,700 (200D MA)
  • Supports: 2,526 (78.6% Fibonacci Retracement Level); 2,470 (20D MA); 2,256 (61.8% Fibonacci Retracement Level)
  • Trend: Start of Down Trend


Continue ReadingUS Market Indices Review: Dow Jones Industrial, S&P500, NASDAQ