Citigroup (C): Buy on Dip?

  • Post author:

Citigroup retraced and found support at the uptrend channel support (also the 61.8% FR) at about $42.23. The stock is still trading in an uptrend. If there is no earning surprises on April 15, 2013, C should continue the uptrend. The next immediate resistance is $47.68. 161.8% Fibonacci Target is $56.16.

C Apr12-2013

Option Trade

  • Strategy: Long Vertical Call Spread (Bullish Trade)
  • Short C May13 45 Call, Long C May13 41 Call
  • Entry Price = $43.44
  • Breakeven Price = $43.43
  • Max Profit = $624
  • Max Loss = $976
  • Reward vs Risk = 64%

Previous Analysis on Citigroup C.

Continue ReadingCitigroup (C): Buy on Dip?

City Development: Rebound!

  • Post author:

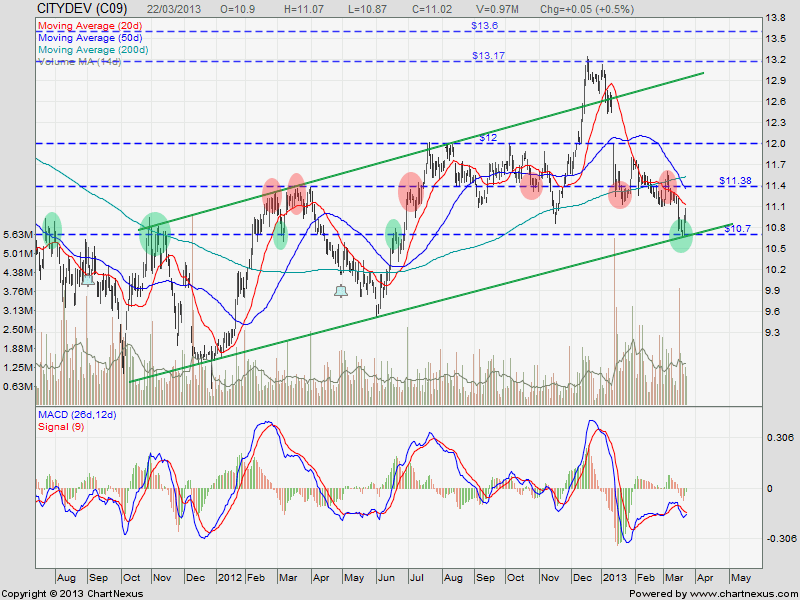
City Development rebound with a Bullish Engulfing (and Three Outside Up) candlestick pattern at the uptrend channel support at about $10.70. This $10.70 is a reliable resistance turned support level. The next significant level is support turned resistance at about $11.38. Current City Development chart represents a good opportunity for a short term bullish trade. This is also a good example that “Chart Pattern + Support / Resistance + Candlestick” is a much better trading strategy compare to the technical indicators like moving averages, MACD, Parabolic SAR, Bollinger Band, etc. These technical indicators still have not shown any bullish signals yet because they are lagging indicators.

2013Mar23-CITYDEV-800x600

Continue ReadingCity Development: Rebound!

Genting Singapore: Continue the Up Trend

  • Post author:

Genting Singapore rebounded nicely from the 20D SMA support and continue the uptrend in the channel. So far 20D SMA proved to be a good support. 2/5 EMA still on bullish signal on both daily and weekly chart. Expect Genting Singapore to reach $1.63 (previous high) followed by all Fibonacci Retracement levels. Alternate scenario: uptrend will be broken if Genting Singapore trades below $1.50.

Continue ReadingGenting Singapore: Continue the Up Trend