First REIT: Up Trend Support Broken!

  • Post author:

First REIT uptrend has ended after the support trend line is broken. First REIT is trading below 20D and 50D SMA. The next support is at $0.975 followed by $0.925.

First REIT Fundamental Analysis

  • Last Done Price = $1.02
  • NAV = $0.7893
  • Price / NAV = 1.2923
  • DPU = $0.06955
  • DPU Yield = 6.819%
  • Gearing Ratio = 15.9%
  • Market Cap = $645.296 M

Summary:

  • Fundamentally & Technically the current level is not the right level to enter. First REIT has very good fundamental in terms on the stability of the distribution income, WALE (Weighted Average of Lease Expiry), gearing ratio and type of properties (hospital). The plan is to wait for First REIT to drop below the NAV and wait for the correction to finish.
  • As First REIT is currently going through a correction base on chart and fundamentally the stock price is over value base on NAV, profit taking is a better option.

Other Singapore REIT Fundamental Comparison Table


Disclaimer: This is only a personal analysis. This is not buy or sell recommendation and I hold no responsibility in anyone profit or loss for trading or investing this stock.



Continue ReadingFirst REIT: Up Trend Support Broken!

Singapore Airlines (SIA): Watch the $11.00 Level

  • Post author:

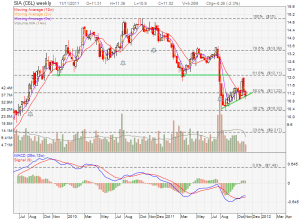
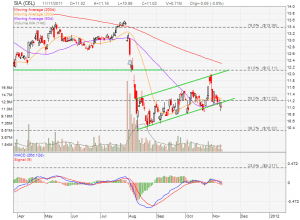
Singapore Airlines (SIA) looks like dropping out from a mini up trend channel support after the recent poor earning announcement. MACD is weakening and the stock price is trading below 20D, 50D and 200D MA. Also take note that 20D MA starts to turn down.

SIA is still on the long term down trend as its 200D MA is sloping down on the daily chart. SIA is also trading just below 2W, 5W, 12W MA of the weekly chart.

Watch this $11.00 support level. Breaking below this support may send SIA down to $9.20 target price of the Head and Shoulders chart pattern. SIA may rebound from this support level but taking into the macro-economy into consideration where most of the corporate have started to impose international travel freeze,  the uncertainty in European debt crisis and the high level of oil price, I don’t see the any positive catalyst to proper SIA to the uptrend.

Continue ReadingSingapore Airlines (SIA): Watch the $11.00 Level

STX OSV: Sell Down with High Volume!

  • Post author:

STX OSV has a massive sell down on last trading day. The stock is currently testing the uptrend channel support and the 61.8% FR support at about $1.216. This uptrend support is also the neckline of a skewed Head and Shoulders chart patten (can you see it?). Breaking this neckline support will send STX OSV to breakdown target price of about $1.00.

Continue ReadingSTX OSV: Sell Down with High Volume!