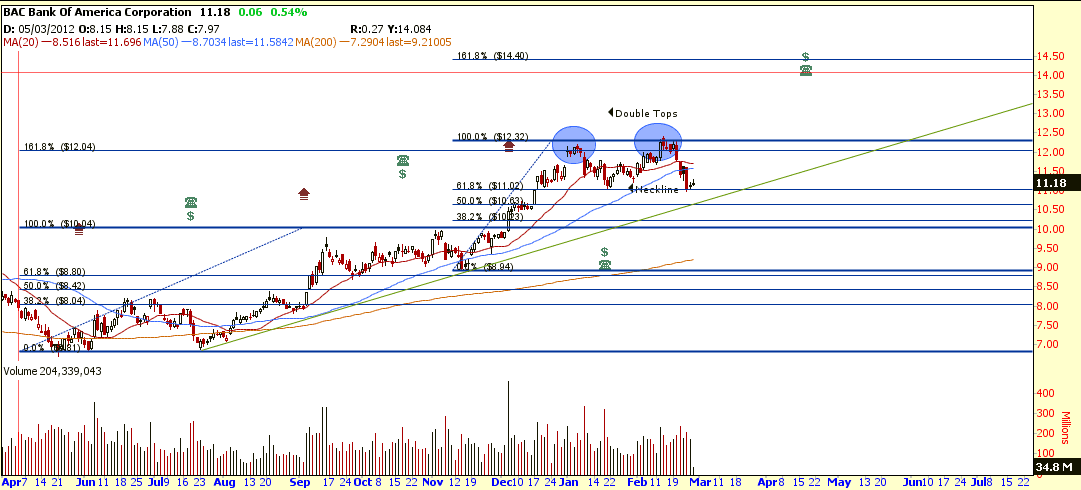
Bank of America (BAC) is forming a Double Tops with neckline at about $11.00. If BAC rebound from this neckline (also the 61.8% FR), BAC will continue the uptrend with price target of $14.40 (161.8% FR). If BAC break below $11.00 support, the price target of this Double Tops breakout is about $10.00
Key Statistics for BAC
| Current P/E Ratio (ttm) | 12.2033 |
|---|---|
| Estimated P/E(12/2013) | 11.2814 |
| Relative P/E vs. SPX | 0.8262 |
| Earnings Per Share (USD) (ttm) | 0.9200 |
| Est. EPS (USD) (12/2013) | 0.9950 |
| Est. PEG Ratio | 1.3017 |
| Market Cap (M USD) | 121,007.57 |
| Shares Outstanding (M) | 10,778.26 |
| 30 Day Average Volume | 157,886,592 |
| Price/Book (mrq) | 0.5546 |
| Price/Sale (ttm) | 1.2045 |
| Dividend Indicated Gross Yield | 0.36% |
| Cash Dividend (USD) | 0.0100 |
| Last Dividend | 02/27/2013 |
| 5 Year Dividend Growth | -55.91% |
| Next Earnings Announcement | 04/17/2013 |

