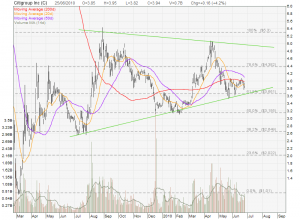
Citigroup has formed a wedge and currently very close to the wedge support near the 61.8% Fibonacci Retracement Level. Currently Citigroup just broke below all the three moving averages (20D, 50D, 200D) which is a bearish sign. Watch closely for the breakout. Base on the chart pattern, breakdown from this wedge pattern may send the stock to $1.00 but personally I think is unlikely to reach that level. I feel that the downside risk is limited and I am waiting Citigroup to go lower after breakout for long term investment.
Citigroup (C) – Forming a Wedge
- Post author:Marubozu
- Post published:June 27, 2010
- Post category:Citigroup (C)
- Post comments:0 Comments
Tags: Wedge

