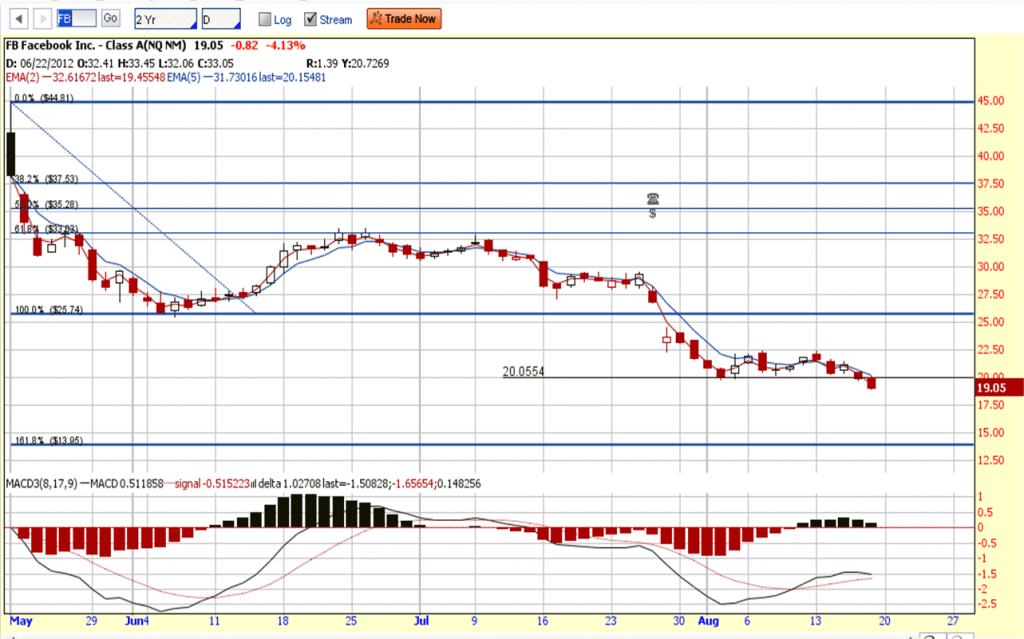
Is it good time to buy Facebook now after dropping 50% since the IPO? Personally I don’t feel it is the right time to long the stock yet base on both Technical and Fundamental Analysis. However, it is a RIGHT time to short Facebook instead because fundamentally FB is over value and technically FB is bearish and continue down trend without any support base on history! So, how low can Facebook go and when is the right entry level? Hmmm… I don’t have the answer and I will let the chart to tell me.
Technically Facebook has broken the $20 psychological support and the previous support, after rebound from the 61.8% Fibonacci Resistance. The next target price for FB is 161.8% Fibonacci Retracement level at $13.95.
Fundamentally Facebook (FB) is over value base on PE Ratio & PEG.
Key Statistics for FB
| Current P/E Ratio (ttm) | 41.4130 |
|---|---|
| Estimated P/E (12/2012 ) | 38.7195 |
| Earnings Per Share (USD) (ttm) | 0.4600 |
| Est. EPS (USD) (12/2012) | 0.4920 |
| Est. PEG Ratio | 1.5613 |
| Market Cap (M USD) | 46,012.75 |
| Shares Outstanding (M) | 674.61 |
| Enterprise Value (M USD) (ttm) | 36,530.75 |
| Enterprise Value/EBITDA (ttm) | – |
| Price/Book (mrq) | 5.9142 |
| Price/Sale (ttm) | 6.6426 |
| Dividend Indicated Gross Yield | – |
| Next Earnings Announcement | 10/25/2012 |


How much is Facebook worth? Base on this article using Discounted EPS model, Facebook value is $18.98. Read on:
http://seekingalpha.com/article/855281-how-much-is-facebook-worth
Facebook shares worth just $15 – Barrons
http://www.marketwatch.com/story/facebook-shares-worth-just-15-barrons-2012-09-24?dist=beforebell