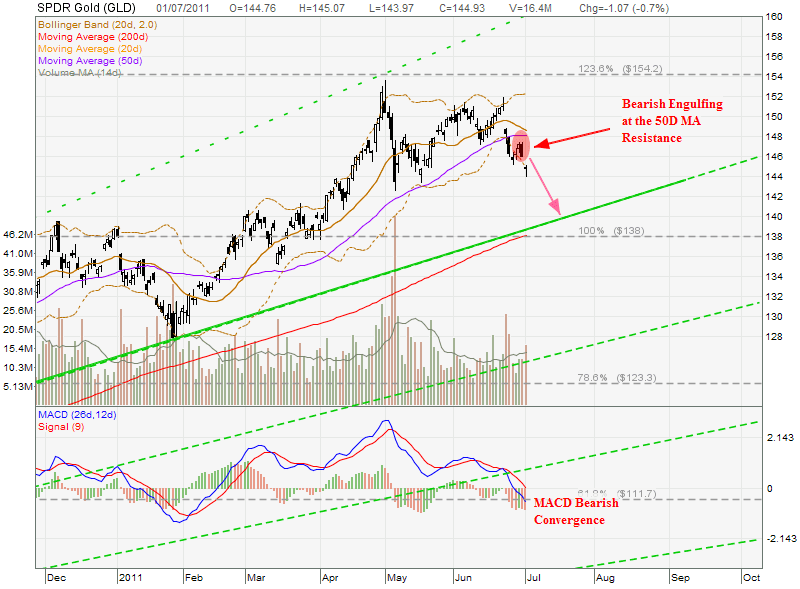
Gold has shown weakness recently and GLD chart has shown a reversal pattern to indicate the pull back.
- GLD has broken 20D and 50D MA with gap down.
- GLD is unable to break the 50D MA resistance although the recent rebound. This 50D MA support now becomes resistance.
- Bearish Engulfing candlestick pattern formed at the 50D MA resistance., after a short rebound.
- Base on the long term GLD uptrend chart pattern, everytime GLD break the 50D MA support, GLD will head towards the uptrend support (also the 23.6% support line of Fibonacci Fan) and the 200D MA.
- MACD Bearish Convergence.
- GLD starts to stick on lower band of Bollinger Band.
Current chart pattern represent a good opportunity to short the SPDR GLD shares and also opportunity to buy on dip when pull back to 200D MA support (provided the Gold rebound from the support).
See other related news:


