Market Indices PE Ratio for Major Stock Exchange globally
- US: Dow Jones Industrial, S&P500, NASDAQ, Russell 2000
- Europe: FTSE100, CAC40, DAX
- Asia: KLCI, STI, HangSeng, ASX200, CSI 300, JCI, SET, KOSPI, NIKKEI 225, SENSEX, TWSE, NZX50, PSEi
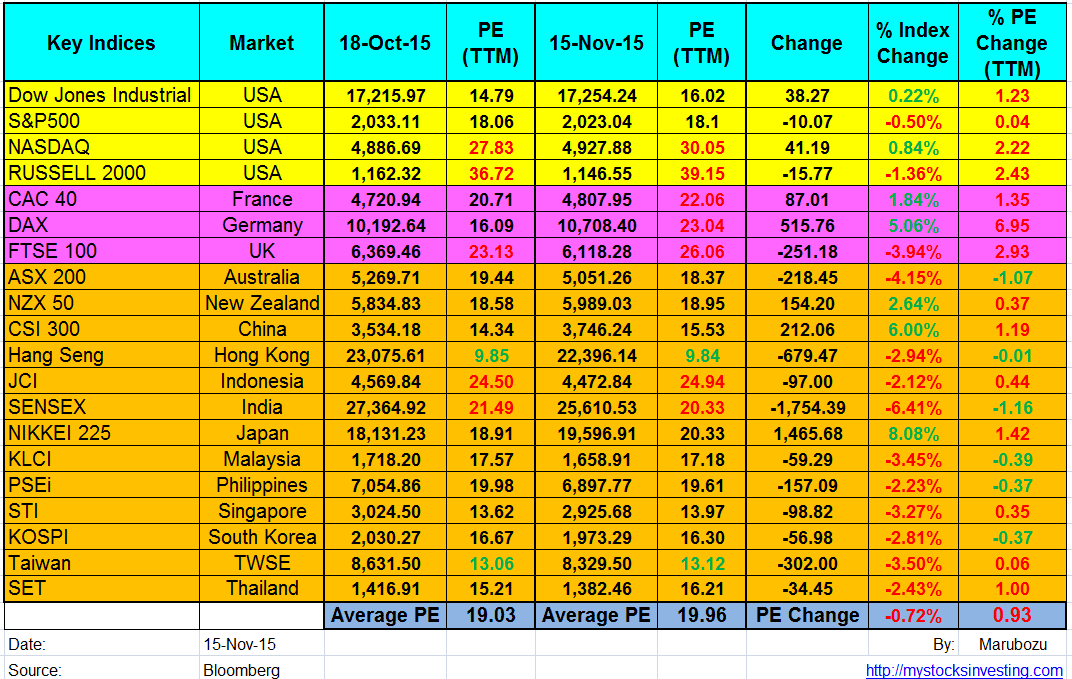
- PE = Price Per Earning
See Oct 2015 Global Stock Market PE Ratio here.
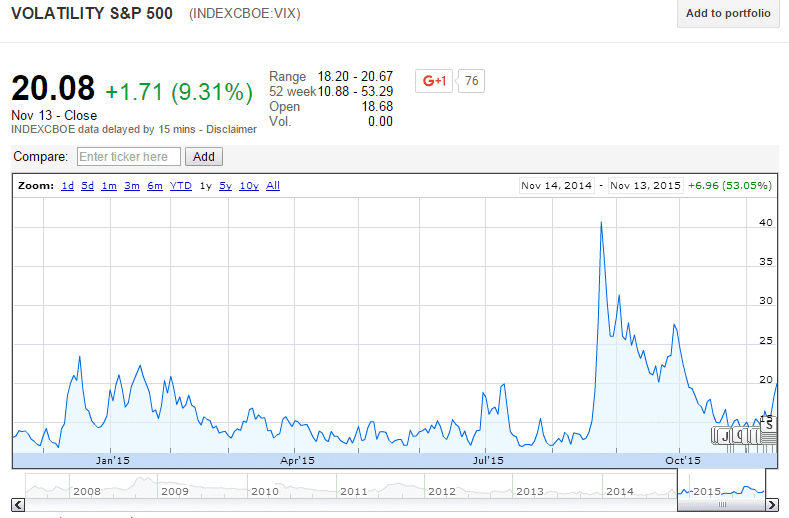
Global Stock Market Average PE ratio increased from 19.03 to 19.96 after the recent huge rebound. Japan Nikkei 225 and China CSI300 are two of the best performers during this rebound with 8% and 6% gain respectively. with more than 7% gain. US Indices retraced after getting near to the historical high and VIX increased to 20.08.


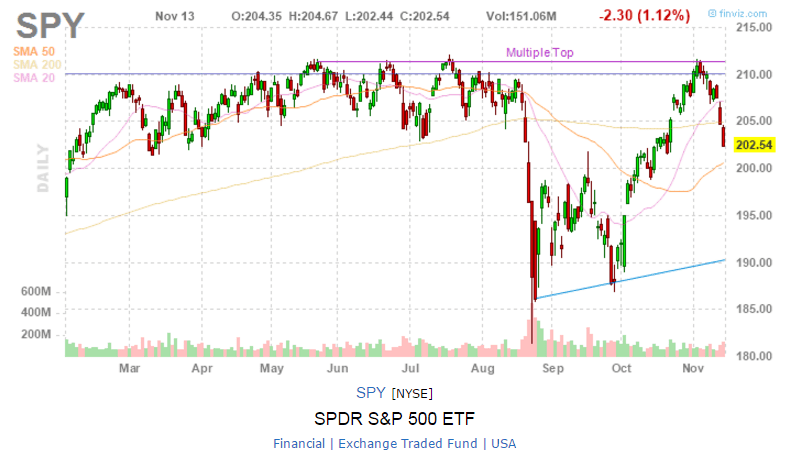
Dow Jones Industrial, S&P500, NASDAQ, Russel 2000 Charts
- $INDU, $SPX, $COMPQ, $RUT, $TRAN are currently pulling back after facing the resistances accordingly. $INDU, $SPX, $COMP dropped back below 200D SMA. $RUT and $TRAN still trading below 200D SMA. If $INDU, $SPX, $COMP are not able to move above 200D SMA, expect another sell down in the coming weeks as the 200D SMA start trending down which is a bearish signal.


Past 1 Month Sector Performance
Added XLRE and XLFS.


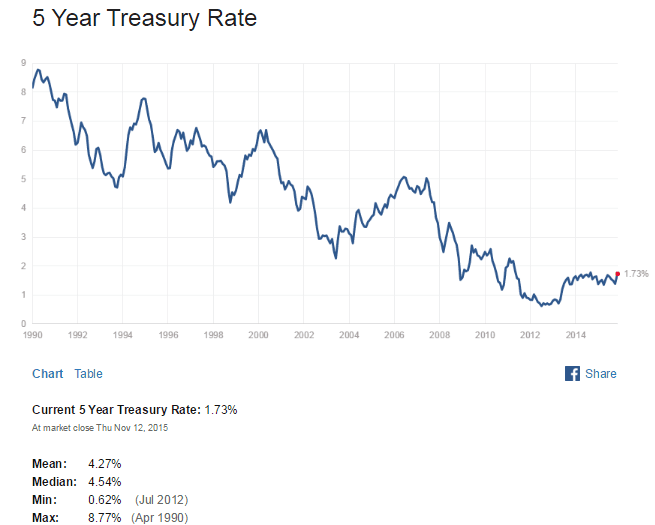
Treasury Yield