
Introduction
Office REITs provide investors with exposure to commercial office properties while generating income through rental revenue. However, not all office REITs offer the same investment characteristics. Differences in portfolio occupancy, rental yields, gearing, financing costs and lease expiry profiles can influence their financial performance and distribution potential.
In this analysis, we compare five Singapore-listed office REITs: Manulife US REIT, KORE US REIT, Keppel REIT, Elite UK REIT and Prime US REIT.
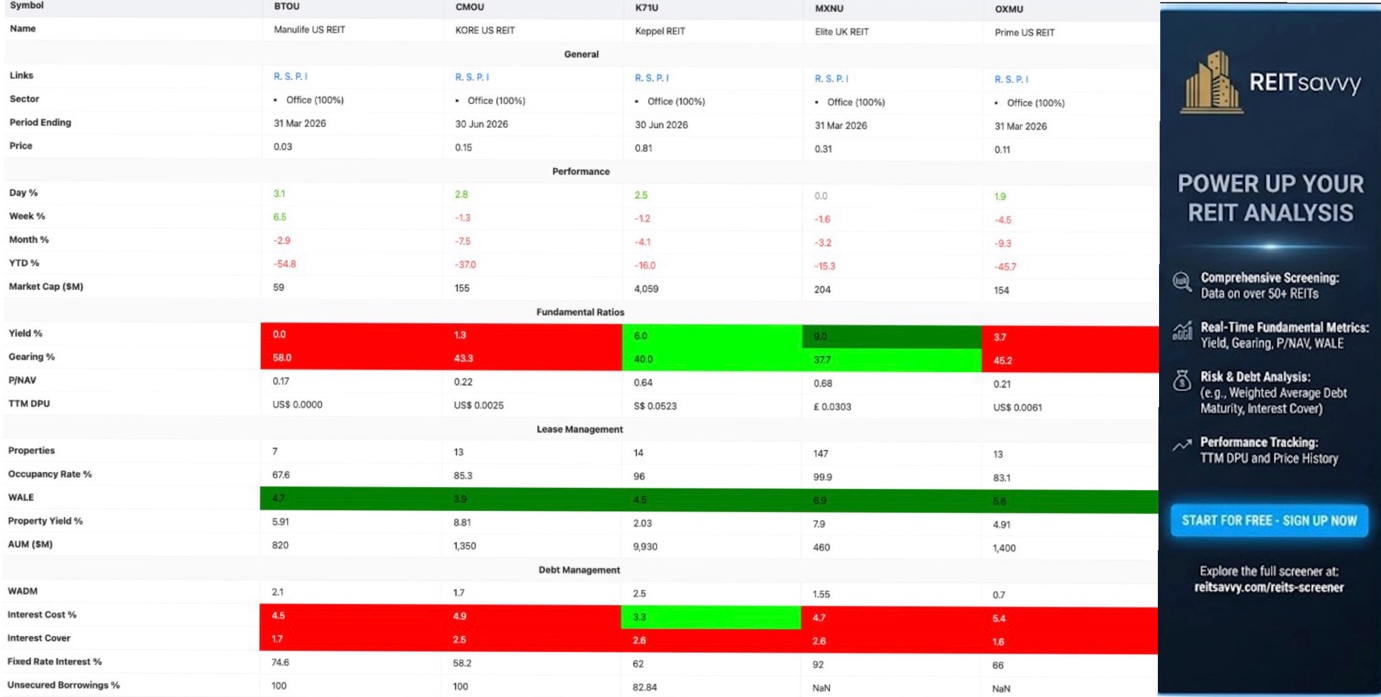
Although all five REITs have 100% office exposure according to the supplied data, their financial and operational profiles differ considerably. The comparison examines their distribution yields, gearing, valuation, occupancy, weighted average lease expiry (WALE) and debt-management metrics to identify the respective tailwinds and headwinds.
1. Manulife US REIT (SGX: BTOU) — Deepest Discount to NAV with the Weakest Financial Profile
Manulife US REIT has the smallest market capitalisation among the five REITs at US$59 million (as presented in the table’s $M denomination) and trades at a significant discount to its net asset value, with a P/NAV ratio of just 0.17 times. However, this discounted valuation comes alongside considerable financial and operational challenges.
The REIT has gearing of 58.0%, occupancy of 67.6% and an interest coverage ratio of 1.7 times. Its distribution yield is also 0.0%, while its YTD unit-price performance stands at -54.8%, the weakest among the five REITs.
Tailwinds:
o Significant Discount to NAV:
Manulife US REIT has the lowest P/NAV ratio at 0.17 times. This means its unit price trades substantially below its reported net asset value. Among the five REITs, it offers the largest discount based on this valuation metric, potentially providing valuation upside if investor confidence and financial performance improve.
o Positive Short-Term Unit-Price Momentum:
Despite its significant YTD decline of 54.8%, Manulife US REIT recorded a positive daily performance of 3.1% and weekly performance of 6.5%. Both figures are the highest among the five REITs. This indicates stronger short-term price momentum within the comparison, although it has not reversed the substantial longer-term decline.
o Reasonable WALE of 4.7 Years:
Its WALE of 4.7 years is longer than KORE US REIT’s 3.9 years and Keppel REIT’s 4.5 years. A longer lease profile provides comparatively more visibility over the timing of lease expiries.
o Property Yield of 5.91%:
Manulife US REIT’s property yield of 5.91% is higher than Keppel REIT’s 2.03% and Prime US REIT’s 4.91%. This provides a comparatively higher property yield within the portfolio comparison, although property yield should be distinguished from the distribution yield received by unitholders.
Headwinds:
o Highest Gearing of 58.0%:
Manulife US REIT has the highest gearing among the five REITs. Higher gearing increases financial leverage and can reduce the REIT’s flexibility when managing debt and property valuations.
o Distribution Yield of 0.0%:
The REIT has the lowest distribution yield in the comparison at 0.0%. This makes it less attractive to investors who prioritise recurring income from their REIT investments.
o Low Occupancy Rate of 67.6%:
Manulife US REIT has the lowest occupancy rate among the five REITs. At 67.6%, its portfolio has a considerably larger proportion of unoccupied space compared with the other REITs. This represents an operational weakness because occupancy directly relates to the amount of leased property space.
o Weak Interest Coverage of 1.7 Times:
Its interest coverage ratio of 1.7 times is the second lowest among the five REITs. This indicates a relatively limited earnings buffer for meeting interest expenses.
o Poor YTD Performance:
Manulife US REIT recorded a YTD decline of 54.8%, making it the worst-performing REIT in this comparison. Its monthly performance is also negative at -2.9%, highlighting continued weakness in its unit-price performance over the periods shown.
o High Unsecured Borrowings:
The table shows unsecured borrowings of 100%. Together with its 58.0% gearing and 4.5% interest cost, this is an important debt-management consideration.
Overall assessment: Manulife US REIT offers the deepest discount to NAV and stronger short-term unit-price momentum, but its high gearing, low occupancy, weak interest coverage and absence of distribution yield make it the highest-risk profile in this comparison.
2. KORE US REIT (SGX: CMOU) — Higher Property Yield but Relatively Shorter WALE
KORE US REIT presents a mixed investment profile, with a relatively high property yield of 8.81% but a comparatively low distribution yield of 1.3%. It has gearing of 43.3%, occupancy of 85.3% and a P/NAV ratio of 0.22 times.
Its market capitalisation stands at $155 million, while its portfolio consists of 13 properties with total AUM of $1,350 million. Although its valuation is significantly below NAV, its unit-price performance remains weak, with a YTD decline of 37.0%.
Tailwinds:
o High Property Yield of 8.81%:
KORE US REIT has the highest property yield among the five REITs. At 8.81%, it is higher than Elite UK REIT’s 7.9%, Manulife US REIT’s 5.91%, Prime US REIT’s 4.91% and Keppel REIT’s 2.03%. This makes its property yield stand out within the comparison.
o Discounted P/NAV Ratio:
KORE US REIT trades at a P/NAV ratio of 0.22 times. This is significantly below 1.0 times and represents a substantial discount to its reported NAV. Its valuation is also slightly higher than Manulife US REIT’s 0.17 times but remains considerably below Keppel REIT and Elite UK REIT.
o Moderate Gearing Compared with Manulife US REIT:
Its gearing of 43.3% is considerably lower than Manulife US REIT’s 58.0%. This indicates a comparatively lower degree of financial leverage within the two REITs.
o Interest Coverage of 2.5 Times:
KORE US REIT has interest coverage of 2.5 times, higher than Manulife US REIT’s 1.7 times and Prime US REIT’s 1.6 times. This provides a comparatively stronger earnings buffer against interest expenses.
o WALE of 3.9 Years:
Although its WALE is the shortest in the comparison, its 3.9-year lease profile means that investors have a measurable lease duration to assess when evaluating future rental-income visibility.
Headwinds:
o Low Distribution Yield of 1.3%:
Despite having the highest property yield of 8.81%, KORE US REIT’s distribution yield is only 1.3%. This difference is important because property yield does not represent the actual income distributed to unitholders. For income-focused investors, its distribution yield is relatively unattractive compared with Keppel REIT and Elite UK REIT.
o Shortest WALE of 3.9 Years:
KORE US REIT has the shortest WALE among the five REITs. Compared with Elite UK REIT’s 6.9 years and Prime US REIT’s 5.6 years, it has a shorter average remaining lease duration. This may result in greater near-term exposure to lease renewals and tenant retention requirements.
o Negative Unit-Price Performance:
Its YTD performance stands at -37.0%, while its monthly and weekly performances are also negative at -7.5% and -1.3%, respectively. This indicates continued weakness across the different periods shown.
o Relatively High Interest Cost:
KORE US REIT has an interest cost of 4.9%, which is higher than Manulife US REIT’s 4.5%, Keppel REIT’s 3.3% and Elite UK REIT’s 4.7%. Higher financing costs can put pressure on the income available after interest expenses.
o High Unsecured Borrowings:
The table shows unsecured borrowings of 100%. This is another debt-management metric investors should monitor alongside its gearing and interest coverage.
Overall assessment: KORE US REIT stands out for its high property yield and discounted valuation. However, its low distribution yield, shorter WALE and negative unit-price performance make it less compelling for investors seeking immediate income. Its ability to translate property-level returns into distributions is an important consideration.
3. Keppel REIT (SGX: K71U) — Balanced Financial Profile with Attractive Distribution Yield
Keppel REIT has the largest market capitalisation among the five REITs at $4,059 million and the largest AUM at $9,930 million. It also has the highest number of properties in the comparison, with 14 properties.
The REIT offers a distribution yield of 6.0%, gearing of 40.0% and occupancy of 96.0%. Its interest cost of 3.3% is the lowest among the five REITs, while its interest coverage ratio of 2.6 times is joint highest with Elite UK REIT.
However, its P/NAV ratio of 0.64 times remains below 1.0 times, and its YTD unit-price performance is -16.0%.
Tailwinds:
o Attractive Distribution Yield of 6.0%:
Keppel REIT offers a distribution yield of 6.0%, the second highest among the five REITs after Elite UK REIT’s 9.0%. This makes it a relatively attractive option for investors seeking recurring income.
o Lowest Interest Cost of 3.3%:
Keppel REIT has the lowest interest cost in the comparison at 3.3%. This is a favourable financing characteristic, as a lower interest expense can reduce the proportion of property income allocated towards servicing debt.
o Strong Occupancy Rate of 96.0%:
Its occupancy rate of 96.0% is the second highest among the five REITs, behind Elite UK REIT’s 99.9%. High occupancy indicates that most of its properties are leased, supporting its rental-income profile.
o Relatively Low Gearing of 40.0%:
Keppel REIT’s gearing of 40.0% is the second lowest among the five REITs. This gives it a comparatively moderate leverage position, particularly when assessed against Manulife US REIT’s 58.0% and Prime US REIT’s 45.2%.
o Strong Interest Coverage of 2.6 Times:
Keppel REIT’s interest coverage ratio of 2.6 times is joint highest in the comparison. Alongside its lowest interest cost, this indicates a comparatively favourable debt-servicing position.
o Large Portfolio and AUM:
Keppel REIT has 14 properties and AUM of $9,930 million, making it the largest REIT in the comparison by AUM. Its larger portfolio and market capitalisation distinguish it from the other four REITs.
Headwinds:
o Lowest Property Yield of 2.03%:
Keppel REIT has the lowest property yield among the five REITs at 2.03%. This is considerably below KORE US REIT’s 8.81% and Elite UK REIT’s 7.9%. Investors comparing property yields may therefore find Keppel REIT less attractive based on this particular metric.
o P/NAV Ratio of 0.64 Times:
Although Keppel REIT trades below NAV, its P/NAV of 0.64 times is higher than the ratios of Manulife US REIT, KORE US REIT and Prime US REIT. This means its valuation discount is comparatively smaller among those four REITs.
o Negative YTD Performance:
Keppel REIT recorded a YTD decline of 16.0%. Although this is substantially better than the losses recorded by Manulife US REIT, KORE US REIT and Prime US REIT, it still indicates negative unit-price performance.
o WALE of 4.5 Years:
Its WALE of 4.5 years is shorter than Manulife US REIT’s 4.7 years, Prime US REIT’s 5.6 years and Elite UK REIT’s 6.9 years. This places Keppel REIT behind those three REITs in terms of average remaining lease duration.
o Fixed-Rate Interest Exposure of 62.0%:
Keppel REIT has 62.0% of its interest exposure at fixed rates. This is lower than Elite UK REIT’s 92.0% and Manulife US REIT’s 74.6%, indicating a comparatively smaller proportion of fixed-rate interest exposure.
Overall assessment: Keppel REIT presents one of the more balanced profiles in the comparison, supported by its attractive distribution yield, high occupancy, lowest interest cost and moderate gearing. Its main weaknesses are its relatively low property yield, smaller discount to NAV and negative unit-price performance.
4. Elite UK REIT (SGX: MXNU) — Highest Distribution Yield with the Strongest Lease Profile
Elite UK REIT stands out for its high distribution yield and favourable lease-management metrics. Based on the supplied data, it has the highest distribution yield of 9.0%, the lowest gearing of 37.7%, the highest occupancy of 99.9% and the longest WALE of 6.9 years.
Its P/NAV ratio is 0.68 times, while its interest coverage ratio is 2.6 times. It also has the lowest YTD decline among the five REITs at 15.3%, making it the relatively strongest performer over the period shown.
Tailwinds:
o Highest Distribution Yield of 9.0%:
Elite UK REIT offers the highest distribution yield among the five REITs. At 9.0%, it is higher than Keppel REIT’s 6.0%, Prime US REIT’s 3.7%, KORE US REIT’s 1.3% and Manulife US REIT’s 0.0%. This makes it particularly attractive to investors who prioritise distribution income.
o Lowest Gearing of 37.7%:
Elite UK REIT has the lowest gearing among the five REITs. Lower gearing generally provides greater financial flexibility and a comparatively less leveraged balance-sheet position.
o Highest Occupancy Rate of 99.9%:
Its occupancy rate of 99.9% is the highest in the comparison. This indicates that almost all its portfolio space is occupied, supporting its rental-income base and minimising vacancy exposure.
o Longest WALE of 6.9 Years:
Elite UK REIT has the longest WALE among the five REITs. A longer lease profile provides greater visibility over the remaining duration of rental agreements and reduces the immediate proportion of leases approaching expiry relative to the other REITs.
o Strong Interest Coverage of 2.6 Times:
Its interest coverage ratio of 2.6 times is joint highest in the comparison, alongside Keppel REIT. This indicates a relatively stronger ability to cover interest expenses based on the earnings measure used.
o Highest Fixed-Rate Interest Exposure of 92.0%:
Elite UK REIT has 92.0% of its interest exposure at fixed rates, the highest among the five REITs. This provides a comparatively greater proportion of fixed-rate financing exposure within the group.
o Strongest YTD Performance:
Elite UK REIT recorded a YTD decline of 15.3%, the smallest decline among the five REITs. Its monthly performance of -3.2% is also better than KORE US REIT’s -7.5%, Prime US REIT’s -9.3% and Keppel REIT’s -4.1%.
Headwinds:
o Higher Property Yield Does Not Necessarily Translate into Higher Distributions:
Despite having a property yield of 7.9%, the difference between its property yield and distribution yield should still be considered. Its 9.0% distribution yield is the highest in the group, but investors should not assume that a high headline yield automatically guarantees sustainable distributions.
o High P/NAV Ratio Within the Comparison:
Elite UK REIT has the highest P/NAV ratio at 0.68 times. Although it still trades below NAV, its valuation discount is smaller than those of the other four REITs.
o Relatively High Interest Cost:
Its interest cost is 4.7%, higher than Keppel REIT’s 3.3% and Manulife US REIT’s 4.5%. This means its financing expenses are comparatively higher than those two REITs.
o Short Weighted Average Debt Maturity:
Elite UK REIT has a WADM of 1.55 years. This is shorter than Manulife US REIT’s 2.1 years, KORE US REIT’s 1.7 years and Keppel REIT’s 2.5 years. A shorter average debt maturity means refinancing requirements may arise sooner, making future financing arrangements an important consideration.
o Negative Unit-Price Momentum:
Despite having the smallest YTD decline, Elite UK REIT still recorded negative returns across the weekly, monthly and YTD periods, at -1.6%, -3.2% and -15.3%, respectively. Its daily performance was unchanged at 0.0%.
Overall assessment: Elite UK REIT has the strongest lease-management profile in the comparison, with the highest occupancy, longest WALE and lowest gearing. Combined with its 9.0% distribution yield, these characteristics make it stand out as the income-focused REIT. However, investors should monitor its debt maturity and remember that its P/NAV discount is the smallest among the five REITs.
5. Prime US REIT (SGX: OXMU) — Deep Valuation Discount but Highest Financing Costs
Prime US REIT trades at a P/NAV ratio of 0.21 times, making it the second-cheapest REIT in the comparison based on this valuation metric. However, its financial position has several weaknesses.
The supplied data shows gearing of 45.2%, interest cost of 5.4%, interest coverage of 1.6 times and a distribution yield of 3.7%. Its occupancy rate is 83.1%, while its WALE is 5.6 years.
Despite having a longer WALE than Manulife US REIT, KORE US REIT and Keppel REIT, Prime US REIT has the highest interest cost and lowest interest coverage ratio among the five REITs.
Tailwinds:
o Significant Discount to NAV:
Prime US REIT has a P/NAV ratio of 0.21 times, the second lowest among the five REITs after Manulife US REIT’s 0.17 times. This represents a substantial discount to its reported NAV and could provide valuation upside if its financial and operational position improves.
o Relatively Long WALE of 5.6 Years:
Prime US REIT has the second-longest WALE after Elite UK REIT. At 5.6 years, its lease profile is longer than Manulife US REIT’s 4.7 years, Keppel REIT’s 4.5 years and KORE US REIT’s 3.9 years. This provides comparatively greater visibility over its remaining lease duration.
o Distribution Yield of 3.7%:
Its distribution yield of 3.7% is higher than KORE US REIT’s 1.3% and Manulife US REIT’s 0.0%. This provides some distribution income for investors, although it remains below Keppel REIT and Elite UK REIT.
o Property Yield of 4.91%:
Prime US REIT has a property yield of 4.91%, which is higher than Keppel REIT’s 2.03%. This provides a comparatively stronger property yield than Keppel REIT within the supplied comparison.
o Positive Daily Performance:
Prime US REIT recorded a daily performance of 1.9%, indicating a positive movement on the day reflected in the table. However, its weekly, monthly and YTD performance figures remain negative.
Headwinds:
o Highest Interest Cost of 5.4%:
Prime US REIT has the highest interest cost among the five REITs. This is a significant financing consideration because higher interest expenses can reduce the income available for distribution.
o Lowest Interest Coverage of 1.6 Times:
Its interest coverage ratio of 1.6 times is the lowest in the comparison. This suggests a relatively limited buffer for servicing interest expenses compared with the other four REITs.
o Shortest Weighted Average Debt Maturity of 0.7 Years:
Prime US REIT has the shortest WADM at just 0.7 years. This is considerably shorter than Keppel REIT’s 2.5 years and Manulife US REIT’s 2.1 years. Its short debt maturity is an important headwind because refinancing requirements may arise sooner.
o Relatively High Gearing of 45.2%:
Its gearing is the second highest among the five REITs after Manulife US REIT. Combined with the highest interest cost and lowest interest coverage, its financial profile appears relatively more stretched.
o Weak YTD Performance:
Prime US REIT recorded a YTD decline of 45.7%, the second-worst performance in the comparison. Its monthly decline of 9.3% is also the largest among the five REITs, indicating considerable weakness in its unit-price performance.
o Occupancy of 83.1%:
Prime US REIT has an occupancy rate of 83.1%, which is lower than Keppel REIT’s 96.0% and Elite UK REIT’s 99.9%. Its occupancy is also below KORE US REIT’s 85.3%, indicating greater vacancy exposure relative to those three REITs.
Overall assessment: Prime US REIT offers a significant discount to NAV and a relatively long WALE, but these characteristics are offset by its high interest cost, low interest coverage and short debt maturity. Its financial position and refinancing requirements are important considerations before treating its discounted valuation as an investment opportunity.
Sector Takeaway
Among the five REITs, Elite UK REIT stands out for its strong occupancy, longest WALE, lowest gearing and highest distribution yield. Keppel REIT also demonstrates a relatively balanced financial profile, supported by its lower interest cost, high occupancy and attractive distribution yield.
KORE US REIT has the highest property yield, while Manulife US REIT and Prime US REIT offer the largest valuation discounts. However, both Manulife US REIT and Prime US REIT have weaker financial metrics that investors should consider carefully.
Ultimately, investors should not assess office REITs based solely on their distribution yields or P/NAV ratios. A more comprehensive comparison should consider the combination of rental and occupancy performance, lease duration, gearing, interest coverage, financing costs and unit-price trends. These metrics help distinguish REITs with stronger financial characteristics from those whose discounted valuations may reflect greater financial and operational challenges.
POWER UP YOUR REIT ANALYSIS
• Comprehensive Screening: Data on over 30+ Singapore REITs
• Real-Time Fundamental Metrics: Yield, Gearing, P/NAV, WALE
• Risk & Debt Analysis: (e.g., Weighted Average Debt Maturity, Interest Cover)
• Performance Tracking: TTM DPU and Price History
SIGN UP NOW and Explore the full screener at: reitsavvy.com/reits-screener
Kenny Loh is a distinguished Wealth Advisory Director (RNF# LKK300389588 Representing Financial Alliance) with a specialisation in holistic investment planning and estate management. He excels in assisting clients to grow their investment capital and establish passive income streams for retirement. Kenny also facilitates tax-efficient portfolio transfers to beneficiaries, ensuring tax-efficient capital appreciation through risk mitigation approaches and optimised wealth transfer through strategic asset structuring.
With over a decade of experience in holistic estate planning, Kenny employs a unique “3-in-1 Will, LPA, and Standby Trust” solution to address clients’ social considerations, legal obligations, emotional needs, and family harmony. He holds double master’s degrees in Business Administration and Electrical Engineering, and is an Associate Estate Planning Practitioner (AEPP), a designation jointly awarded by The Society of Will Writers & Estate Planning Practitioners (SWWEPP) of the United Kingdom and Estate Planning Practitioner Limited (EPPL), the accreditation body for Asia.
You can join his Telegram channel #REITirement – SREIT Singapore REIT Market Update and Retirement related news. https://t.me/REITirement