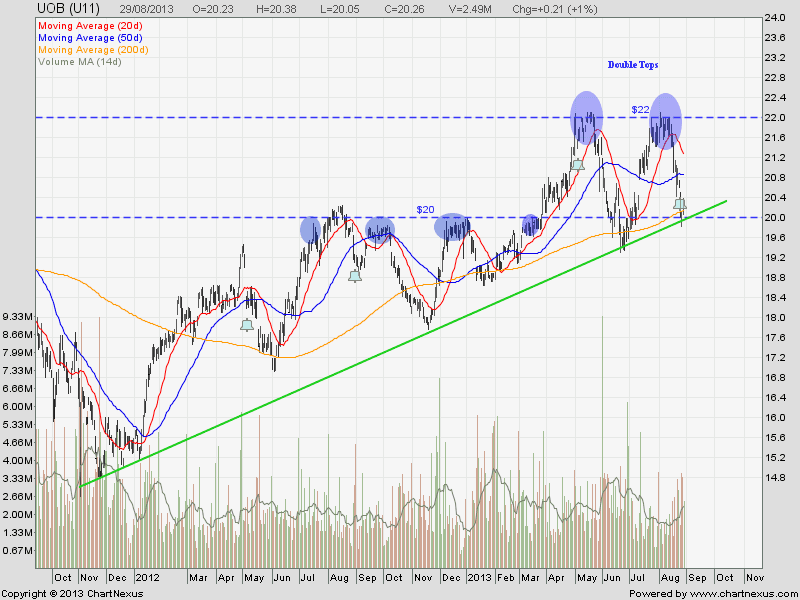
UOB: Double Tops

  • Post author:

Original post from https://mystocksinvesting.com

I love UOB chart because I can trade either direction!

Currently UOB has just rebounded from the uptrend support with next significant resistance at $22. Alternatively, UOB can go as low as $18 if the uptrend support (also the neckline of the Double Tops & 200D SMA support) is broken at about $20.

Simply love it!

2013Aug29-UOB-800x600

Key Statistics for UOB

Current P/E Ratio (ttm) 11.3501
Estimated P/E(12/2013) 11.4918
Relative P/E vs. FSSTI 0.9236
Earnings Per Share (SGD) (ttm) 1.7850
Est. EPS (SGD) (12/2013) 1.7630
Est. PEG Ratio 1.6034
Market Cap (M SGD) 31,914.11
Shares Outstanding (M) 1,575.23
30 Day Average Volume 1,910,367
Price/Book (mrq) 1.3496
Price/Sale (ttm) 3.7070
Dividend Indicated Gross Yield 2.96%
Cash Dividend (SGD) 0.2000
Last Dividend 08/26/2013
5 Year Dividend Growth 1.49%
Next Earnings Announcement 11/05/2013
Continue ReadingUOB: Double Tops

Apple (AAPL) Trade Idea

  • Post author:

Chart Pattern: AAPL breakout from Inverted Head and Shoulders with neckline about $460. AAPL also broke the 200D SMA resistance and technically entered into bullish trend. The stock also retraced to retest the neckline support to confirm this is a successful breakout.

Trading Strategy: Short Put Spread.

  • Target Entry zone:
    • Scenario 1: $470-$480 when AAPL retraces back to Fibonacci Fan support. Currently AAPL is facing the 261.8% Fibonacci Resistance.
    • Scenario 2: If AAPL breakouts from current Bull Pennant / Bull Flag (above $510)
  • Scenario 1
    • STO AAPL Oct 13 480 Put
    • BTO AAPL Oct 13 470 Put
  • Scenario 2
    • STO AAPL Oct 13 510 Put
    • BTO AAPL Oct 13 500 Put
  • Minimum Price Target : $530 (Inverted Head and Shoulders Breakout Target)

AAPL Chart

AAPL Aug23-2013


AAPL Fundamental

AAPL Fundamental Aug23-2013

AAPL Intrinsic Value

  • Operating Cash Flow = $52,894 Million
  • No of Shares outstanding = 908.5 Million
  • Beta = 0.98
  • Discount Rate = 6%
  • No Growth (0% for next 10 years), IV = $443
  • Conservative Growth (5% for next 10 years), IV = $563
  • Moderate Growth (9% for next 10 years), IV = $709
  • Adjusted Growth Rate (12% for next 10 years). IV = $826


Chart from thinkorswim, get FREE chart here.

Original post by Marubozu from My Stocks Investing Journey.


Continue ReadingApple (AAPL) Trade Idea