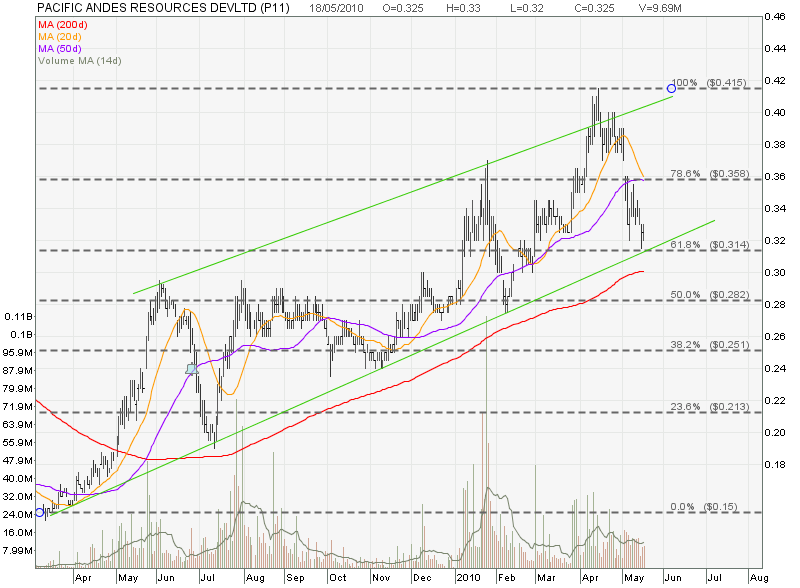
Pacific Andes – Testing Up Trend Channel’s Support
Pacific Andes is currently testing the uptrend channel support at about $0.314. This channel support coincides with a significant 61.8% Fibonacci Retracement Level.
Things to watch out for:
- Whether there is any trend reversal candlestick pattern to confirm Pacific Andes bounces off this support level. If yes, the uptrend channel is probably still in tact and the next resistance is $0.358.
- If this $0.314 support level is broken, the next immediate support is $0.282 (50% FR Level). This level has been proven as a very tough resistance to break for past 4 occasions. This resistance turned support is a significant support level.