I have to make a disclaimer. Murphy’s Law!

  • Post author:

Thanks for my buddy’s reminder that I better make a disclaimer here just in case. Murphy’s law always applied and I don’t want to get into any trouble in future by sharing my ideas and stock analysis here.

Whatever I write in this blog is my personal opinion and ideas. I am not a stockbroker, broker dealers, or any registered investment advisors. I am just a beginner learning how to invest using technical analysis and value investment methods learnt from my course. If any particular stocks and investments are mentioned, they are just my “homeworks” (I have buddies system to kick each other butt) or “leisure works”. It is not a recommendation to purchase or sell any of the securities, businesses or investment discussed in the blog.

I base on my own understanding to do the analysis but I cannot provide any warranty or guarantee regarding the accuracy, reliability, veracity or completeness of the information provided herein. The author and those are so kind to provide comments here disclaim any responsibility for any liability, loss or risk, which may arises as a consequence, directly or indirectly, from the use and application of any of the ideas, strategies or techniques I share here.

End of the serious stuff!

Continue ReadingI have to make a disclaimer. Murphy’s Law!

Sunningdale Tech – good momentum with good volume

  • Post author:

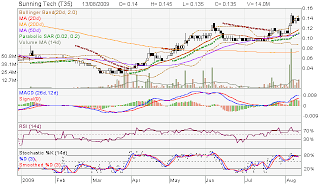
I have been avoiding over-value STI index component stocks and just investing in penny stocks with short term momentum. Sunning Tech has been active with good volume recently and expect the company to turn into black pending for the last quarter financial report announcement.

Using Standard Six Technical Analysis Method to analyse the stock momentum.

  • MACD – still bullish converge (bullish)
  • Parabolic SAR – Stock price on top (bullish)
  • Boilinger Band – at upper band (bullish)
  • Moving Average (MA) – stock price above 20D, 50D, 200D MA lines.
  • RSI – around 60 (less bullish)
  • Stochastic – going to hit 80% (bullish)
The support level at $0.10 and $0.12. I think the downside possibility is minimal for a few reasons:

  • The worst crisis has gone. Economy seems to have bottomed up and the fear factors are no longer there.
  • The company expect to make profit again after in the red for so many quarters.
  • The NAV (Net Asset Value) is $0.33. Current stock price is only $0.135 which is way below $0.33. (Layman term: if the company goes bankrupt and liquidated, you can get back $0.33 per share)
  • The company is still generating positive cashflow base on Q109 financial result.
  • Current Ratio is 1.2. Short term will not have any liquidity issue (layman term: the company will not go bankrupt)

WORST CASE: If all my Technical Analysis are wrong, I just keep the stock and wait for the price to go back to the fair value. I still be able to make money if I can hold the stock long enough.
Continue ReadingSunningdale Tech – good momentum with good volume

Chartered has a nice uptrend wave with a solid Fibonacci fitting!

  • Post author:

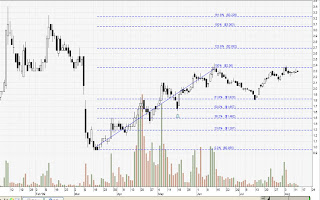
I am still losing money with Chartered shares. Besides waiting for the semiconnductor manufacturing recovery, the beautiful wave shown by CharteredSc tell us some story.


In addition, the stock price retraced back to 61.8% which is a solid Fibonacci retracement level. I should have bought more shares when the share price at $1.80. Frankly speaking, I was panic when it hit $1.80 and worried that whether the stock price will go lower WITHOUT looking at the chart (another lesson learnt for not analysing the chart constantly!). I am waiting for a big correction to happen before I invest this stock again. Isn’t it a good stock to monitor as the company is going to be profitable again in the next one or two quarters and the chart is showing us a very nice wave? It looks more predictable on the stock price now.

Continue ReadingChartered has a nice uptrend wave with a solid Fibonacci fitting!