What Do The Cycles Say About October?
By Dave & Donald Moenning, StartoftheMarkets.com
Based on the early action, it appears that traders have moved into a schizophrenic mode as Tuesday’s gains could be reversed quickly at the open.
At issue is the simple fact that no one really knows what to expect in terms of the duration of the government shutdown. And, the bottom line is markets hate uncertainty.
Optimism Fading Fast
At least part of Tuesday’s advance was based on the idea that the government shutdowns since 1980 have not produced large sell-offs in the stock market While the algorithms have been trained to react at the speed of light to any and all headlines coming out of Washington D.C., reports made the rounds yesterday that historically, stocks have managed to advance the vast majority of the time (ten out of eleven occurrences) in the two weeks following a government shutdown.
In addition, there was the Bloomberg report, which stated that since 1976, the S&P has risen 11 percent on average in the ensuing twelve months following a shutdown. Given that such a return is actually higher than the average twelve-month period returns seen in the stock market, some traders may have decided to take a more upbeat stance – especially with the S&P having been down seven of the past eight sessions and having become oversold in the process.
Back To Reality – And the Debt
However, traders appear to be back to reality on this fine Wednesday morning. The fear is that with the political brinkmanship showing absolutely no signs of abating, the drama could easily continue for a while and eventually spill over into the debt-ceiling deadline.
Frankly, the worry has always been about the debt ceiling. Treasury Secretary Lew said Tuesday that his department is taking extraordinary measures in its efforts to avoid running out of money the middle of this month, but that his options are running short. Since most traders likely remember that the credit rating of the U.S. government was stripped of its ‘AAA’ status the last time Congress failed to act on the debt ceiling in a timely manner and that stocks suffered mightily in response, traders appear to be heading to the exits at the present time.
Time To Review The Cycle Projections
Although the news of the day is likely to dominate trading in the coming days and weeks, investors should remember that the month of October has a bad reputation for generating large losses. So, with the market looking uncertain, it is time to review what the historical cycles have to say about the month October.
Since this is the tenth review of the cycle composite this year, there is probably little need to go over all the disclosures/disclaimers again. The bottom line is that analysis of cycles should not be used in a vacuum or as a stand-alone indicator. However, the data continues to be an important input into our daily and weekly Market Environment models.
For anyone new to this analysis, the cycle composite is a combination of the one-year seasonal, the four-year Presidential, and the 10-year decennial cycles – all going back to 1928.
October Has a Bad Reputation
Most investors likely live in fear of the month of October as the month’s bad reputation has been earned on the back of numerous market crashes over the years. However, it is important to note that when the market isn’t involved with a horrific decline, October isn’t half bad. But given the market’s propensity to dive hard during the month, there are certainly some traders who enter October with a cautious stance.
Is The Market In Sync With The Cycle Projections?
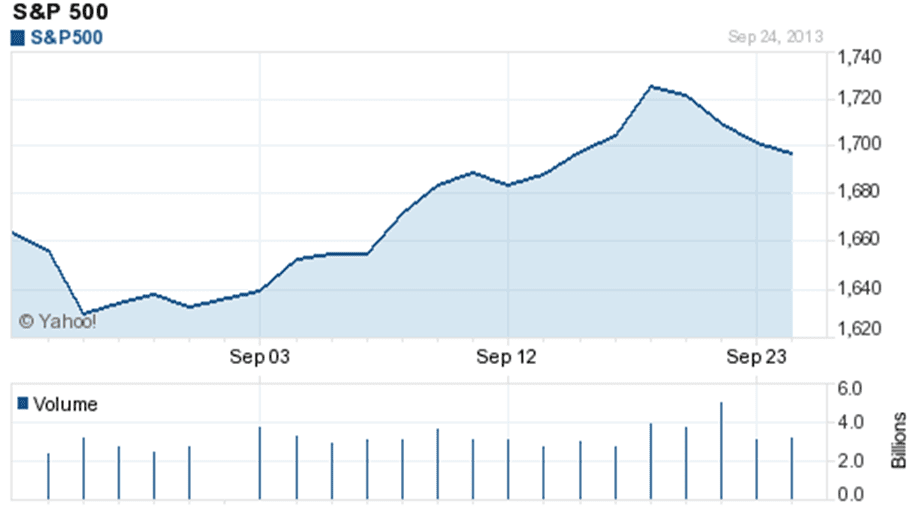
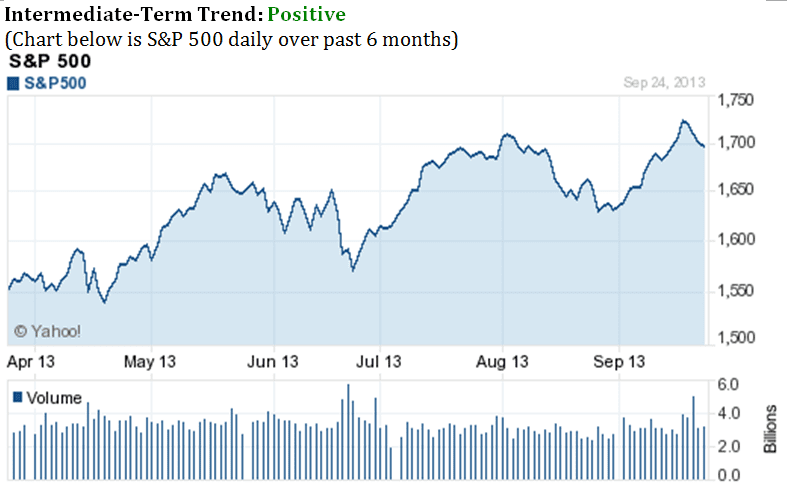
The first step in the analysis of the cycles is to get a feel for whether or not the cycle projections are “on” or not at the present time. Looking at how the market acted relative to the cycle composite in September, it should be noted that the stock market went opposite the cycle composite’s projection in the first half of the month and then got back in sync in the second half.
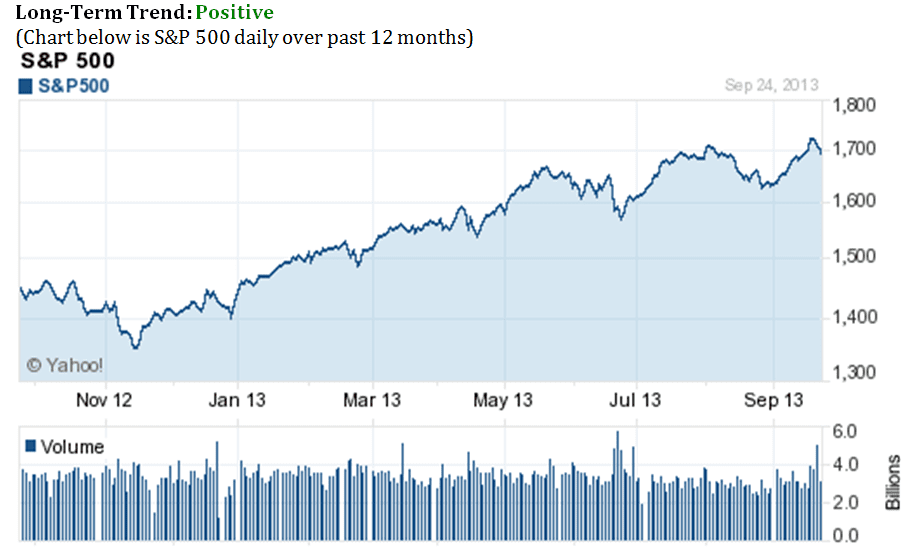
But from a longer-term point of view, the market (as defined by the S&P 500) continues to generally act in accordance with how the composite projection says it should in 2013. And in looking at the market versus the projections since 2009, it is clear that the S&P is fairly close to where it is projected to be.
What Does October Look Like?
The next step is to take a look at what the cycle projections are calling for during the coming month:
One-Year Cycle: The picture painted by the one-year seasonal cycle is not terribly positive. After a period of sideways consolidation in the first part of the month, volatility returns. And after an intense move in both directions two-thirds of the way through the month, a downtrend materializes that lasts until the beginning of November.
Four-Year Cycle: The four-year Presidential cycle projection is similar to the one-year, although the moves are more clear and pronounced. In short, the month opens with a rally and then the meaningful correction that began in August resumes into the end of the month.
10-Year Cycle: The good news is the 10-year cycle looks very different from the one- and four-year cycles. The 10-year suggests the month will be more of a sideways affair and end on a positive note (and with a plus-sign).
The Cycle Composite: The overall cycle composite suggests that October will be volatile with an early rally giving way to a stout pullback and then a modest rally into the end of the month.
So there you have it. It would appear that the cycles are suggesting that the current stalemate in D.C. will (a) continue and (b) produce some damage to investors’ portfolios. Here’s hoping that the projections are wrong and that the politicians come down off of their high horses sooner rather than later.
Mr. David Moenning is a full-time professional money manager and is the President and Chief Investment Strategist at Heritage Capital Management. He focuses on stock market risk management, stock analysis, stock trading, market news and research. Claim a copy of Dave’s Special Report covering changes in the current market.


