Singapore REIT Monthly Update (June 5th 2022)

  • Post author:

Technical Analysis of FTSE ST REIT Index (FSTAS351020)


FTSE ST Real Estate Investment Trusts (FTSE ST REIT Index) decreased from 853.56 to 820.69 (-3.85%) compared to last month’s update. FTSE REIT Index is currently trading within the 800-822 range.

  • Support Lines: Blue
  • Resistance Lines: Red
  • Short-term direction: Sideways
  • Medium-term direction: Sideways
  • Long-term direction: Sideways
  • Immediate Support at 800
  • Immediate Resistance at 822, followed by 890


Previous chart on FTSE ST REIT index can be found in the last post: Singapore REIT Fundamental Comparison Table on May 1st, 2022.


Fundamental Analysis of 39 Singapore REITs


The following is the compilation of 39 Singapore REITs with colour-coding of the Distribution Yield, Gearing Ratio and Price to NAV Ratio.

  • The Financial Ratios are based on past data and there are lagging indicators.
  • This REIT table takes into account the dividend cuts due to the COVID-19 outbreak. Yield is calculated trailing twelve months (ttm), therefore REITs with delayed payouts might have lower displayed yields, thus yield displayed might be lower for more affected REITs.
  • All REITs are updated with the latest Q1 2022 business updates/earnings.
  • Digital Core REIT’s yield is extracted from the IPO Prospectus, calculated based on *Estimated DPU (calculated from the Prospectus) / Current Price.
  • ESR REIT and ARA LOGOS Logistics Trust has merged to form ESR-LOGOS REIT. ALOG REIT is no longer shown, shown values are for ESR REIT.

Data from StocksCafe REIT Screener. https://stocks.cafe/kenny/advanced


What does each Column mean?

  • FY DPU: If Green, FY DPU for the recent 4 Quarters is higher than that of the preceding 4 Quarters. If Lower, it is Red.
    • Most REITs are green since it is compared to FY20/21 as the base (during the pandemic)
  • Yield (ttm): Yield, calculated by DPU (trailing twelve months) and Current Price as of June 3rd, 2022
    • Digital Core REIT: Yield calculated from IPO Prospectus.
  • Gearing (%): Leverage Ratio.
  • Price/NAV: Price to Book Value. Formula: Current Price (as of June 3rd, 2022) over Net Asset Value per Unit.
  • Yield Spread (%): REIT yield (ttm) reference to Gov Bond Yields. REITs trading in USD is referenced to US Gov Bond Yield, everything else is referenced to SG Gov Bond Yield.
  •  

Price/NAV Ratios Overview

  • Price/NAV decreased to 0.95.
    • Decreased from 0.99 from May 2022.
    • Singapore Overall REIT sector is undervalued now.
    • Take note that NAV is adjusted upwards for some REITs due to pandemic recovery.
  • Most overvalued REITs (based on Price/NAV)
    • Parkway Life REIT (Price/NAV = 2.08)
    • Keppel DC REIT (Price/NAV = 1.54)
    • Mapletree Industrial Trust (Price/NAV = 1.34)
    • Ascendas REIT (Price/NAV = 1.17)
    • Mapletree Logistics Trust (Price/NAV = 1.12)
    • Elite Commercial REIT (Price/NAV = 1.11)
    • No change to the Top 3 compared to the March to May updates.
  • Most undervalued REITs (based on Price/NAV)
    • BHG Retail REIT (Price/NAV = 0.58)
    • Lippo Malls Indonesia Retail Trust (Price/NAV = 0.58)
    • EC World REIT (Price/NAV = 0.67)
    • OUE Commercial REIT (Price/NAV = 0.69)
    • ARA Hospitality Trust (Price/NAV = 0.70)
    • Starhill Global REIT (Price/NAV = 0.74)
    • No change to the Top 3 compared to the May updates.

Distribution Yields Overview

  • TTM Distribution Yield increased to 6.30%
    • Increased from 6.00% in May 2022.
    • 14 of 40 Singapore REITs have distribution yields of above 7%. (Same as last month’s update)
    • Do take note that these yield numbers are based on current prices taking into account the delayed distribution/dividend cuts due to COVID-19, and economic recovery. 
  • Highest Distribution Yield REITs (ttm)
    • United Hampshire REIT (10.08%)
    • EC World REIT (9.86%)
    • Prime US REIT (9.48%)
    • First REIT (9.19%)
    • Keppel Pacific Oak REIT (9.06%)
    • Manulife US REIT (8.81%)
    • Reminder that these yield numbers are based on current prices taking into account delayed distribution/dividend cuts due to COVID-19.
    • Some REITs opted for semi-annual reporting and thus no quarterly DPU was announced.
    • A High Yield should not be the sole ratio to look for when choosing a REIT to invest in.
  • Yield Spread increased to 3.47%.
    • Increased from 3.44% in May 2022.

Gearing Ratios Overview

  • Gearing Ratio decreased to 36.83%. 
    • Decreased from 37.05% in May 2022.
    • Gearing Ratios are updated quarterly. Therefore all REITs have Q1 2022 updates which have updated gearing ratios.
    • In general, Singapore REITs sector gearing ratio is healthy but increased due to the reduction of the valuation of portfolios and an increase in borrowing due to Covid-19.
  • Highest Gearing Ratio REITs
    • ARA Hospitality Trust (44.9%)
    • Suntec REIT (43.3%)
    • Lippo Malls Indonesia Retail Trust (42.9%)
    • Manulife US REIT (42.8%)
    • Elite Commercial REIT (42.8%)
    • Frasers Hospitality Trust (42.3%)
    • No change to the Top 3 compared to the April and May update.

Market Capitalisation Overview

  • Total Singapore REIT Market Capitalisation decreased by 2.75% to S$109.16 Billion.
    • Decreased from S$112.25 Billion in May 2022.
  • Biggest Market Capitalisation REITs:
    • Capitaland Integrated Commercial Trust ($14.65B)
    • Ascendas REIT ($11.71B)
    • Mapletree Logistics Trust ($7.95B)
    • Mapletree Industrial Trust ($6.67B)
    • Mapletree Commercial Trust ($5.96B)
    • Frasers Logistics & Commercial Trust ($4.94B)
    • No change in Top 5 rankings since August 2021.
  • Smallest Market Capitalisation REITs:
    • BHG Retail REIT ($272M)
    • ARA US Hospitality Trust ($383M)
    • Lippo Malls Indonesia Retail Trust ($408M)
    • United Hampshire REIT ($466M)
    • Sabana REIT ($492M)
    • EC World REIT ($502M)
    • No change in Top 4 rankings compared to March to May updates.

Disclaimer: The above table is best used for “screening and shortlisting only”. It is NOT for investing (Buy / Sell) decision. If you want to know more about investing in REITs, here’s a subsidised 2-day course with all you need to know about REITs and how to start investing in them.


Top 20 Worst Performers of the Month in May 2022


 (Source: https://stocks.cafe/kenny/advanced)


SG 10 Year & US 10 Year Government Bond Yield

  • SG 10 Year: 2.82% (increased from 2.52%)
  • US 10 Year: 2.92% (increased from 2.87%)


Major REIT News in May 2022


S-REITs Earnings Season for the Period Ending 31 Mar 2022 has wrapped up

A total of 39 S-REITs have released their earnings/business updates for the Period Ending 31 Mar 2022 (28 Feb 2022 for SPH Reit).


MCT, MNACT shareholders approved merger

THE BUSINESS TIMES: Unit holders of Mapletree Commercial Trust (MCT) and Mapletree North Asia Commercial Trust (MNACT) have voted in favour of a merger to create one of Asia’s 10 largest real estate investment trusts (Reits).

The merged entity, to be named Mapletree Pan Asia Commercial Trust (MPACT), will have a theoretical market capitalisation of approximately $10.5 billion – ranking it among the top three Reits listed in Singapore, behind CapitaLand Integrated Commercial Trust and Ascendas Reit.

At separate extraordinary general meetings (EGMs) on Monday (May 23), all resolutions to pave the way for the merger were duly passed. At MCT’s EGM in the morning, some 91.7 per cent of MCT unit. Read More


ESR-LOGOS REIT starts trading

ESR-Logos Reit : J91U +1.22% ended its first day of trading on Thursday (May 5) on the Singapore Exchange at S$0.395, unchanged from its opening price.

The units were trading 1.3 per cent or S$0.005 higher than the last closing price of the counter, when it was previously known as ESR-Reit, with 476,000 units changing hands at the open. ESR-Reit had closed flat on Wednesday at S$0.39, on an ex-distribution basis.

On Thursday, the counter hit an intra-day high of S$0.40 at 9.09am, before easing to trade at an intra-day low of S$0.39 at 2.39pm. It ended the day at S$0.395, down S$0.005 or 1.3 per cent, with some 8.7 million units changing hands.

E-Log Reit was formed after a merger between ESR-Reit and Ara Logos Logistics Trust (ALog Trust), following the merger between the 2 Reits’ sponsors – ESR Cayman and ARA Asset Management. Read More


Summary


Fundamentally, the whole Singapore REITs landscape is undervalued based on the average Price/NAV value of the S-REITs. Below is the market cap heat map for the past 1 month. Generally, S-REITs in the past month have decreased in market cap. 

Only 6 REITs increased in Market Cap the past month. They are ESR-LOGOS REIT (6.41%), Lendlease REIT (5.11%), ParkwayLife REIT (3.77%), Sabana REIT (1.11%), Keppel DC REIT (0.99%) and Mapletree NAC Trust (0.83%). Both ESR-LOGOS REIT and Mapletree NAC Trust’s growth can be attributed to their respective mergers, the enlarged ESR-LOGOS REIT started trading on 5th May, and for MNACT, the merger with MCT has been approved by shareholders.


(Source: https://stocks.cafe/kenny/overview)

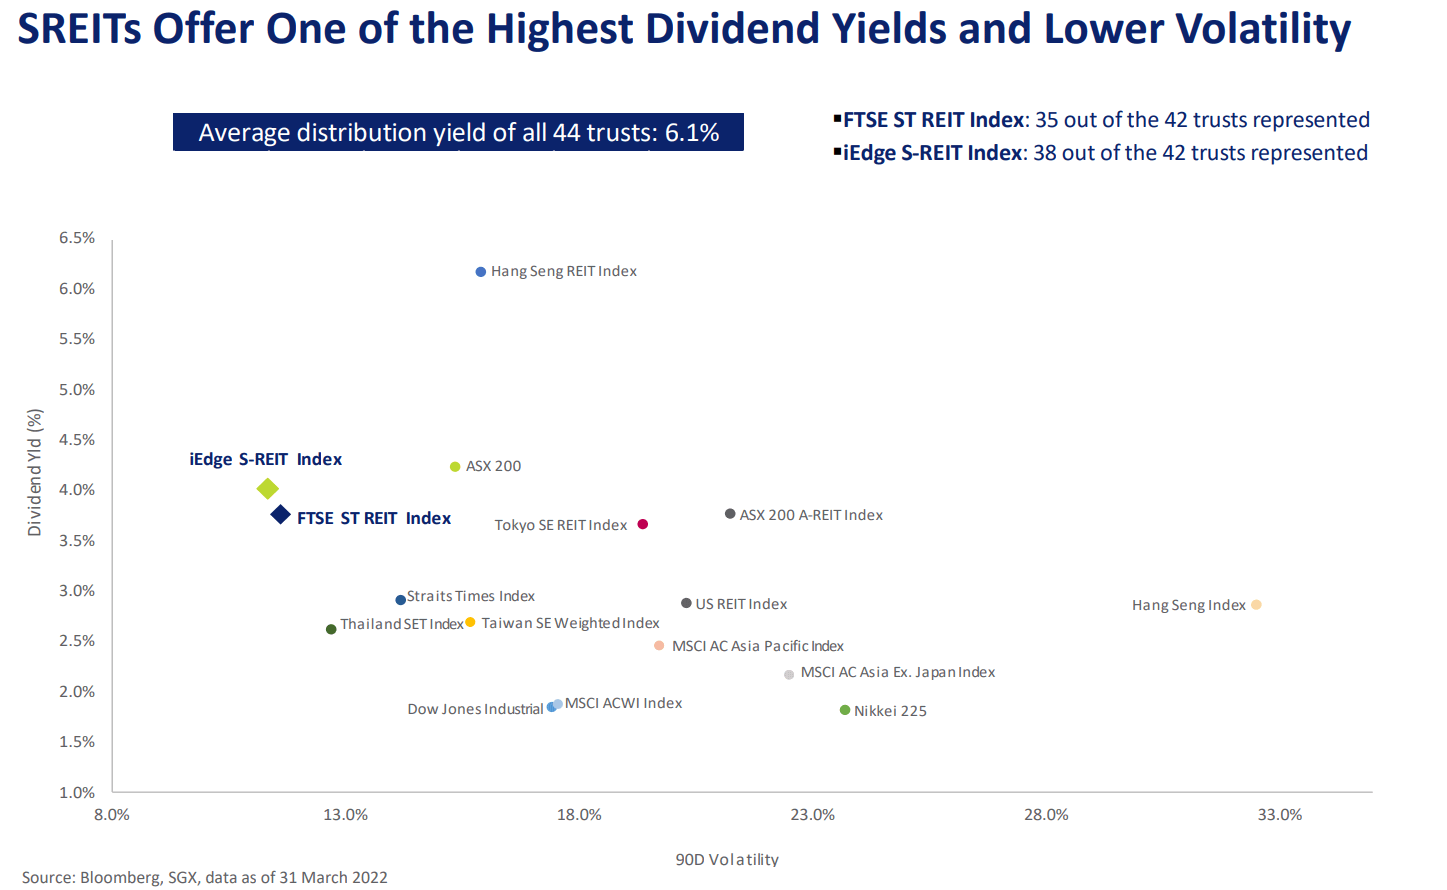
Yield spread (in reference to the 10 year Singapore government bond of 2.82% as of 3rd June 2022) loosened slightly from 3.44% to 3.47%. The S-REIT Average Yield increased from 6.00% to 6.30%, but the increase in the Government Bond Yields offsets this Average S-REIT Yield increase. The yield of the REITs sector needs to increase to maintain the average yield spread of 4%. Amid all the negative news, S-REITs have been resilient and have one of the highest risk-adjusted dividend yields compared to other stock exchanges.


The risk premium has dropped, but still remains attractive (compared to other asset classes) to accumulate Singapore REITs in stages to lock in the current price and to benefit from long-term yield after the recovery, especially since the S-REIT Market is still at a fair value. Moving forward, it is expected that DPU will continue to increase due to the recovery of the global economy, as seen in the previous few earning updates, especially for Hospitality REITs. NAV is expected to be adjusted upward due to revaluation of the portfolio.


Upcoming Events


You may follow my coming REITs webinar and market updates:


MoneyFM 89.3 Interview


June 10th 2022, 10am


Listen as I speak with Michelle Martin and discuss about the REIT space in Singapore, and the REIT Market Outlook. Simply tune in at 10am.

*For New Investors / those looking to invest in REITs*


Free Webinar: How to build your REIT portfolio into your retirement plan


June 13th 2022, 7pm

Participants will have insight on the characteristics of REITs as an Asset Class, and able to explore the benefits and suitability of REITs in building their retirement portfolio.

Participants will appreciate the important factors to consider when building their retirement portfolio to minimise their investment risks.

Participants will be guided to construct a diversified portfolio to attain their retirement objective.

*For Current Investors of REITs / those looking to learn more*

Physical Seminar: S-REIT Market Update & 4 Pains of REITs investing @ Phillip Securities

June 25th 2022, 10am

Singapore REITs enjoyed a good first half of 2022. Can it continue?

US Fed will continue tightening monetary policy and is likely to raise interest rates by 0.5 percentage points in at least two more FOMC meetings. Will this be good or bad for REITs?

What should you do if you’re holding REITs or looking to buy now?

What are the ‘4 pains’ every REITs investor suffers from and how can you overcome them?


Note: This above analysis is for my own personal research and it is NOT a buy or sell recommendation. Investors who would like to leverage my extensive research and years of Singapore REIT investing experience can approach me separately for a REIT Portfolio Consultation.

Kenny Loh is an Associate Wealth Advisory Director  and REITs Specialist of Singapore’s top Independent Financial Advisor. He helps clients construct diversified portfolios consisting of different asset classes from REITs, Equities, Bonds, ETFs, Unit Trusts, Private Equity, Alternative Investments, Digital Assets and Fixed Maturity Funds to achieve an optimal risk adjusted return. Kenny is also a CERTIFIED FINANCIAL PLANNER, SGX Academy REIT Trainer, Certified IBF Trainer of Associate REIT Investment Advisor (ARIA) and also invited speaker of REITs Symposium and Invest Fair.  You can join my Telegram channel #REITirement – SREIT Singapore REIT Market Update and Retirement related news. https://t.me/REITirement

Continue ReadingSingapore REIT Monthly Update (June 5th 2022)

Singapore REIT Monthly Update (May 1st 2022)

  • Post author:

Technical Analysis of FTSE ST REIT Index (FSTAS351020)


FTSE ST Real Estate Investment Trusts (FTSE ST REIT Index) decreased from 864.41 to 853.56 (-1.25%) compared to last month’s update. The Singapore REIT index reached a high of 873 on April 5th, before falling into the 850-862 range since April 7th, staying in that range ever since.

  • Support Lines: Blue
  • Resistance Lines: Red
  • Short-term direction: Sideways
  • Medium-term direction: Sideways
  • Long-term direction: Sideways
  • Immediate Support at 850, followed by 807.
  • Immediate Resistance at 862, followed by 890


Previous chart on FTSE ST REIT index can be found in the last post: Singapore REIT Fundamental Comparison Table on April 3rd, 2022.


Fundamental Analysis of 40 Singapore REITs


The following is the compilation of 40 Singapore REITs with colour-coding of the Distribution Yield, Gearing Ratio and Price to NAV Ratio.

  • The Financial Ratios are based on past data and there are lagging indicators.
  • This REIT table takes into account the dividend cuts due to the COVID-19 outbreak. Yield is calculated trailing twelve months (ttm), therefore REITs with delayed payouts might have lower displayed yields, thus yield displayed might be lower for more affected REITs.
  • Many REITs have been updated with the latest Q1 2022 business updates/earnings, while REITs that have yet to release business updates/earnings are still using Q4 2021 data.
  • Digital Core REIT’s yield is extracted from the IPO Prospectus, calculated based on *Estimated DPU (calculated from the Prospectus) / Current Price.

Data from StocksCafe REIT Screener. https://stocks.cafe/kenny/advanced


What does each Column mean?

  • FY DPU: If Green, FY DPU for the recent 4 Quarters is higher than that of the preceding 4 Quarters. If Lower, it is Red.
    • Most REITs are green since it is compared to FY20/21 as the base (during the pandemic)
  • Yield (ttm): Yield, calculated by DPU (trailing twelve months) and Current Price as of April 29th, 2022
    • Digital Core REIT: Yield calculated from IPO Prospectus.
  • Gearing (%): Leverage Ratio.
  • Price/NAV: Price to Book Value. Formula: Current Price (as of April 2nd, 2022) over Net Asset Value per Unit.
  • Yield Spread (%): REIT yield (ttm) reference to Gov Bond Yields. REITs trading in USD is referenced to US Gov Bond Yield, everything else is referenced to SG Gov Bond Yield.
  •  

Price/NAV Ratios Overview

  • Price/NAV decreased to 0.99.
    • Decreased from 1.00 from April 2022.
    • Singapore Overall REIT sector is at fair value now.
    • Take note that NAV is adjusted downward for most REITs due to drop in rental income during the pandemic (Property valuation is done using DCF model or comparative model)
  • Most overvalued REITs (based on Price/NAV)
    • Parkway Life REIT (Price/NAV = 2.06)
    • Keppel DC REIT (Price/NAV = 1.56)
    • Mapletree Industrial Trust (Price/NAV = 1.41)
    • ARA LOGOS Logistics Trust (Price/NAV = 1.27)
    • Mapletree Logistics Trust (Price/NAV = 1.20)
    • Ascendas REIT (Price/NAV = 1.20)
    • No change to the Top 3 compared to March and April updates.
  • Most undervalued REITs (based on Price/NAV)
    • BHG Retail REIT (Price/NAV = 0.60)
    • Lippo Malls Indonesia Retail Trust (Price/NAV = 0.61)
    • EC World REIT (Price/NAV = 0.70)
    • ARA US Hospitality Trust (Price/NAV = 0.72)
    • OUE Commercial REIT (Price/NAV = 0.74)
    • Starhill Global REIT (Price/NAV = 0.74)

Distribution Yields Overview

  • TTM Distribution Yield increased to 6.00%.
    • Increased from 5.86% in April 2022.
    • 14 of 40 Singapore REITs have distribution yields of above 7%. (Same as last month’s update)
    • Do take note that these yield numbers are based on current prices taking into account the delayed distribution/dividend cuts due to COVID-19, and economic recovery. 
  • Highest Distribution Yield REITs (ttm)
    • United Hampshire REIT (9.76%)
    • EC World REIT (9.64%)
    • Prime US REIT (9.10%)
    • Keppel Pacific Oak REIT (8.63%)
    • Manulife US REIT (8.53%)
    • Sasseur REIT (8.51%)
    • Reminder that these yield numbers are based on current prices taking into account delayed distribution/dividend cuts due to COVID-19.
    • Some REITs opted for semi-annual reporting and thus no quarterly DPU was announced.
    • A High Yield should not be the sole ratio to look for when choosing a REIT to invest in.
  • Yield Spread decreased to 3.44%.
    • Decreased from 3.49% in April 2022.

Gearing Ratios Overview

  • Gearing Ratio remained similar at 37.05%. 
    • Changed from 37.03% in April 2022.
    • Gearing Ratios are updated quarterly. (Those with Q1 2022 updates have updated gearing ratios)
    • In general, Singapore REITs sector gearing ratio is healthy but increased due to the reduction of the valuation of portfolios and an increase in borrowing due to Covid-19.
  • Highest Gearing Ratio REITs
    • ARA Hospitality Trust (44.3%)
    • Suntec REIT (43.3%)
    • Lippo Malls Indonesia Retail Trust (42.9%)
    • Manulife US REIT (42.8%)
    • Elite Commercial REIT (42.4%)
    • Frasers Hospitality Trust (42.3%)
    • No change to the Top 3 compared to April update.

Market Capitalisation Overview

  • Total Singapore REIT Market Capitalisation increased slightly by 0.32% to S$112.25 Billion.
    • Increased from S$111.89 Billion in April 2022.
  • Biggest Market Capitalisation REITs:
    • Capitaland Integrated Commercial Trust ($15.40B)
    • Ascendas REIT ($12.01B)
    • Mapletree Logistics Trust ($8.36B)
    • Mapletree Industrial Trust ($6.94B)
    • Mapletree Commercial Trust ($6.21B)
    • Frasers Logistics & Commercial Trust ($5.34B)
    • No change in Top 5 rankings since August 2021.
  • Smallest Market Capitalisation REITs:
    • BHG Retail REIT ($281M)
    • ARA US Hospitality Trust ($402M)
    • Lippo Malls Indonesia Retail Trust ($460M)
    • United Hampshire REIT ($479M)
    • Sabana REIT ($486M)
    • First REIT ($508M)
    • No change in Top 4 rankings compared to March and April updates.

Disclaimer: The above table is best used for “screening and shortlisting only”. It is NOT for investing (Buy / Sell) decision. If you want to know more about investing in REITs, here’s a subsidised 2-day course with all you need to know about REITs and how to start investing in them.

Top 20 Worst Performers of the Month in April 2022


 (Source: https://stocks.cafe/kenny/advanced)

SG 10 Year & US 10 Year Government Bond Yield

  • SG 10 Year: 2.52% (increased from 2.37%)
  • US 10 Year: 2.87% (increased from 2.39%)

Major REIT News in April 2022


S-REITs Earnings Season for the Period Ending 31 Mar 2022 is well underway

A total of 22 S-REITs have released their earnings/business updates (as of April 29th 2022) for the Period Ending 31 Mar 2022 (28 Feb 2022 for SPH Reit), with the remainder set to do so through end-May.

Upcoming S-Reits’ earnings releases’ schedule

THE BUSINESS TIMES: SPH REIT : SK6U 0% kicked off the current financial reporting season for S-Reits on Apr 1,l 2022 with with the release of its H1 FY2022 (ended Feb 28, 2022) financial results. This was followed by other S-Reits, including Keppel DC Reit : AJBU +0.48% (Q1 business update), Keppel Pacific Oak US Reit : CMOU +0.68% (Q1 business update), Mapletree North Asia Commercial Trust : RW0U 0% (full-year results), Keppel Reit : K71U -1.6% (Q1 business update), Mapletree Commercial Trust : N2IU +1.07% (full-year results), Digital Core Reit : DCRU +5.82% (Q1 business update) and Sabana Industrial Reit (Q1 business update), over a 3-day period from Apr 19 to 21, 2022.  

Another 22 S-Reits have also confirmed that they will unveil financial results or business updates between Apr 22, 2022 and May 12, 2022 for their respective periods ended Mar 31, 2022. Among them, 3 would be reporting full-year financial results, 4 would be reporting first-half or first-quarter financial results, and another 15 would be providing quarterly business updates. Read More

REITs that have yet to release earnings/business updates as of April 29th, 2022:

ARA HTrust USD (XZL), Ascendas Reit (A17U), BHG Retail Reit (BMGU), ARA Logos Log Trust (K2LU), CDL HTrust (J85), CromwellReit EUR (CWBU), EC World Reit (BWCU), Elite Commercial REIT GBP (MXNU), Daiwa House Log Trust (DHLU), Far East HTrust (Q5T), First Reit (AW9U), Frasers Log & Com Tr (BUOU), IREIT Global (UD1U), Lendlease Reit (JYEU), ManulifeReit USD (BTOU), OUE Com Reit (TS0U), Prime US Reit USD (OXMU), Sasseur Reit (CRPU), UtdHampshReitUSD (ODBU).

S-REIT Table at a glance.

REITs Symposium 2022 is happening on 21st May!

REITs Symposium is BACK! This year, it’s a MEGA-Hybrid event, which will take place at Suntec Exhibition Hall on 21 May and broadcasted LIVE simultaneously to online viewers! Do express your interest if you want to participate on-site, spaces are limited! I will be moderating 5 REIT Interviews with CEOs, namely United Hampshire US REIT, BHG REIT, Elite Commercial REIT, Ascott Residence Trust and First REIT.

With optimism of the world re-opening and being on a pedestal of being truly global REIT hub, what does this all mean for S-REIT investors? Will inflationary pressures be overshadowed by re-opening optimism? For this year’s REITs Symposium, join us as we invite the CEOs of selected S-REITs and multiple industry experts, to answer these pertinent questions.

Register Now!


Summary


Fundamentally, the whole Singapore REITs landscape is at fair value based on the average Price/NAV value of the S-REITs. Below is the market cap heat map for the past 1 month. Generally, S-REITs in the past month have decreased in market cap. 

All 5 Hospitality REITs are part of this month’s 11 strongest performers. This can be attributed to the full reopening of Singapore’s borders for vaccinated travelers. 

Capitaland Integrated Commercial Trust (+2.19%)‘s gains can be attributed to the lifting of ‘back to office’ COVID restrictions, and institutional fund inflow. 

Suntec REIT (+4.55%)‘s gains can also be attributed to the lifting of ‘back to office’ COVID restrictions, and the resumption of convention centre events. The coming REIT Symposium 2022 will be held at Suntec Convention Centre on the 21st May! Sign up/View Event Details here.

(Source: https://stocks.cafe/kenny/overview)

Yield spread (in reference to the 10 year Singapore government bond of 2.52% as of 29th April 2022) continued to tighten from 3.49% to 3.44%. The S-REIT Average Yield increased from 5.86% to 6.00%, but the increase in the Government Bond Yields offsets this Average S-REIT Yield increase. The yield of the REITs sector needs to increase to maintain the average yield spread of 4%. Amid all the negative news, S-REITs have been resilient and have one of the highest risk-adjusted dividend yields compared to other stock exchanges.

S-REITs have been resilient and have one of the highest risk-adjusted dividend yields compared to other stock exchanges.

The risk premium has dropped, but still remains attractive (compared to other asset classes) to accumulate Singapore REITs in stages to lock in the current price and to benefit from long-term yield after the recovery, especially since the S-REIT Market is still at a fair value. Moving forward, it is expected that DPU will continue to increase due to the recovery of the global economy, as seen in the previous few earning updates, especially for Hospitality REITs. NAV is expected to be adjusted upward due to revaluation of the portfolio.

You can listen to my monthly REIT radio interview on MoneyFM89.3 here.

Note: This above analysis is for my own personal research and it is NOT a buy or sell recommendation. Investors who would like to leverage my extensive research and years of Singapore REIT investing experience can approach me separately for a REIT Portfolio Consultation.

Kenny Loh is an Associate Wealth Advisory Director  and REITs Specialist of Singapore’s top Independent Financial Advisor. He helps clients construct diversified portfolios consisting of different asset classes from REITs, Equities, Bonds, ETFs, Unit Trusts, Private Equity, Alternative Investments, Digital Assets and Fixed Maturity Funds to achieve an optimal risk adjusted return. Kenny is also a CERTIFIED FINANCIAL PLANNER, SGX Academy REIT Trainer, Certified IBF Trainer of Associate REIT Investment Advisor (ARIA) and also invited speaker of REITs Symposium and Invest Fair.  You can join my Telegram channel #REITirement – SREIT Singapore REIT Market Update and Retirement related news. https://t.me/REITirement

Continue ReadingSingapore REIT Monthly Update (May 1st 2022)

Singapore REIT Monthly Update (April 3rd 2022)

  • Post author:

Technical Analysis of FTSE ST REIT Index (FSTAS351020)


FTSE ST Real Estate Investment Trusts (FTSE ST REIT Index) increased from 827.88 to 864.41 (4.41%) compared to the last month update. The Singapore REIT index rebounded off from the support level at 807 3 times, broke the 836 resistance turned support level and is now trading between the 836-890 range.

  • Support Lines: Blue
  • Resistance Lines: Red
  • Short-term direction: Upwards
  • Medium-term direction: Sideways
  • Long-term direction: Sideways
  • Immediate Support at 836, followed by 807.
  • Immediate Resistance at 890.

The REIT Index traded between 807 and 836 for much of March, before breaking the 836 resistance on March 17. It has entered a short-term uptrend since then, reaching 864.41 as of now.

Previous chart on FTSE ST REIT index can be found in the last post: Singapore REIT Fundamental Comparison Table on March 6th, 2022.

Fundamental Analysis of 40 Singapore REITs


The following is the compilation of 40 Singapore REITs with colour coding of the Distribution Yield, Gearing Ratio and Price to NAV Ratio.

  • The Financial Ratios are based on past data and there are lagging indicators.
  • This REIT table takes into account the dividend cuts due to the COVID-19 outbreak. Yield is calculated trailing twelve months (ttm), therefore REITs with delayed payouts might have lower displayed yields, thus yield displayed might be lower for more affected REITs.
  • All REITs are now updated with the Q4 2021 business updates/earnings. SPH REIT has the latest Q1 2022 business updates/earnings.
  • Digital Core REIT has recently IPOed in December (highlighted in yellow) and have their values extracted from IPO Prospectuses. Yield is calculated based on *Estimated DPU (calculated from the Prospectus) / Current Price.

Data from StocksCafe REIT Screener. https://stocks.cafe/kenny/advanced

What does each Column mean?

  • FY DPU: If Green, FY DPU for the recent 4 Quarters is higher than that of the preceding 4 Quarters. If Lower, it is Red.
    • Most REITs are green since it is compared to 2020 as the base (during the pandemic)
  • Yield (ttm): Yield, calculated by DPU (trailing twelve months) and Current Price as of April 2nd, 2022
    • Digital Core REIT: Yield calculated from IPO Prospectus.
  • Gearing (%): Leverage Ratio.
  • Price/NAV: Price to Book Value. Formula: Current Price (as of April 2nd, 2022) over Net Asset Value per Unit.
  • Yield Spread (%): REIT yield (ttm) reference to Gov Bond Yields. REITs trading in USD is referenced to US Gov Bond Yield, everything else is referenced to SG Gov Bond Yield.
  •  

Price/NAV Ratios Overview

  • Price/NAV increased to 1.00.
    • Changed from 0.97 from March 2022.
    • Singapore Overall REIT sector is at fair value now.
    • Take note that NAV is adjusted downward for most REITs due to drop in rental income during the pandemic (Property valuation is done using DCF model or comparative model)
  • Most overvalued REITs (based on Price/NAV)
    • Parkway Life REIT (Price/NAV = 2.03)
    • Keppel DC REIT (Price/NAV = 1.69)
    • Mapletree Industrial Trust (Price/NAV = 1.50)
    • Mapletree Logistics Trust (Price/NAV = 1.36)
    • Digital Core REIT (Price/NAV = 1.33)
    • ARA LOGOS Logistics Trust (Price/NAV = 1.26)
    • No change in the Top 6 constituents compared to last month (March 6th 2022 update)
  • Most undervalued REITs (based on Price/NAV)
    • Lippo Malls Indonesia Retail Trust (Price/NAV = 0.56)
    • BHG Retail REIT (Price/NAV = 0.62)
    • ARA US Hospitality Trust (Price/NAV = 0.71)
    • OUE Commercial REIT (Price/NAV = 0.74)
    • Starhill Global REIT (Price/NAV = 0.76)
    • Far East Hospitality Trust (Price/NAV = 0.76)

Distribution Yields Overview

  • TTM Distribution Yield decreased to 5.86%.
    • Decreased from 6.00% in March 2022.
    • 14 of 40 Singapore REITs have distribution yields of above 7%.
    • Do take note that these yield numbers are based on current prices taking into account the delayed distribution/dividend cuts due to COVID-19, and economic recovery. 
  • Highest Distribution Yield REITs (ttm)
    • United Hampshire REIT (9.38%)
    • Prime US REIT (9.04%)
    • Keppel Pacific Oak US REIT (8.68%)
    • EC World REIT (8.64%)
    • First REIT (8.56%)
    • Elite Commercial REIT (8.42%)
    • Reminder that these yield numbers are based on current prices taking into account delayed distribution/dividend cuts due to COVID-19.
    • Some REITs opted for semi-annual reporting and thus no quarterly DPU was announced.
    • A High Yield should not be the sole ratio to look for when choosing a REIT to invest in.
  • Yield Spread decreased to 3.49%.
    • Decreased from 4.14% in March 2022.

Gearing Ratios Overview

  • Gearing Ratio remained similar at 37.03%. 
    • Decreased from 37.04% in March 2022.
    • Gearing Ratios are updated quarterly. Only SPH REIT has its gearing ratio updated compared to last month.
    • In general, Singapore REITs sector gearing ratio is healthy but increased due to the reduction of the valuation of portfolios and an increase in borrowing due to Covid-19.
  • Highest Gearing Ratio REITs
    • ARA Hospitality Trust (44.3%)
    • Suntec REIT (43.7%)
    • Manulife US REIT (42.8%)
    • Frasers Hospitality Trust (42.5%)
    • Lippo Malls Retail Trust (42.5%)
    • Elite Commercial REIT (42.4%)
    • No Change compared to last month’s update

Market Capitalisation Overview

  • Total Singapore REIT Market Capitalisation increased by 4.71% to S$111.89 Billion.
    • Increased from S$106.86 Billion in February 2022.
  • Biggest Market Capitalisation REITs:
    • Capitaland Integrated Commercial Trust ($15.07B)
    • Ascendas REIT ($12.37B)
    • Mapletree Logistics Trust ($8.69B)
    • Mapletree Industrial Trust ($7.18B)
    • Mapletree Commercial Trust ($6.28B)
    • Frasers Logistics & Commercial Trust ($5.46B)
    • No change in Top 5 rankings since August 2021.
  • Smallest Market Capitalisation REITs:
    • BHG Retail REIT ($292M)
    • ARA US Hospitality Trust ($381M)
    • Lippo Malls Indonesia Retail Trust ($407M)
    • United Hampshire REIT ($440M)
    • First REIT ($490M)
    • Sabana REIT ($503M)
    • No change in Top 6 rankings compared to last month’s update

Disclaimer: The above table is best used for “screening and shortlisting only”. It is NOT for investing (Buy / Sell) decision. If you want to know more about investing in REITs, here’s a subsidised 2-day course with all you need to know about REITs and how to start investing in them.

Top 20 Best Performers of the Month in March 2022


 (Source: https://stocks.cafe/kenny/advanced)

SG 10 Year & US 10 Year Government Bond Yield

  • SG 10 Year: 2.37% (increased from 1.84%)
  • US 10 Year: 2.39% (decreased from 1.77%)

Major REIT News in March 2022


ESR, ALOG Unitholders vote in favour of merger to form ESR-LOGOS REIT

THE BUSINESS TIMES: THE managers of ESR-Reit [ESR-REIT : J91U -1.16%] and Ara Logos Logistics Trust (ALog Trust) [ARA LOGOS Log Tr : K2LU -0.59%] must surely be heaving huge sighs of relief.

After a series of speed bumps, the managers of the 2 real estate investment trusts (Reits) have finally gotten the nod of approval by their respective unitholders to go ahead with the merger to form ESR-Logos Reit (E-Log Reit).

At its extraordinary general meeting (EGM) at 10 am on Monday (Mar 21), unitholders of ESR-Reit voted overwhelmingly in favour of the merger.


Some 98.6 per cent of unitholders voted in favour of the merger, and 98.4 per cent agreed to the issuance of new ESR-Reit units to ALog Trust unitholders at an issue price of S$0.4924 apiece as part of the consideration of the merger.

Valid votes were cast by unitholders holding a total of 1.22 billion ESR-Reit units.

“The EGM results validate our belief that unitholders appreciate the importance of size and scale as we embark on our next phase of growth,” said Adrian Chui, chief executive officer of the ESR-Reit manager. Read More here

View our 2-part Q&A Series with ESR REIT and ALOG REIT here, with your questions regarding the merger answered.

Part 1 with ESR REIT

Part 2 with ARA LOGOS Logistics Trust

Summary


Fundamentally, the whole Singapore REITs landscape is at fair value based on the average Price/NAV value of the S-REITs. Below is the market cap heat map for the past 1 month. Generally, S-REITs in the past month have increased in market cap. 

Notably, 4 of 5 of the strongest performers are Hospitality REITs. This can be attributed to the full reopening of Singapore’s borders for vaccinated travelers. Only 6 REITs have dropped in the past month.

(Source: https://stocks.cafe/kenny/overview)

Yield spread (in reference to the 10 year Singapore government bond of 2.37% as of 3rd April 2022) tightened significantly from 4.14% to 3.49%. The S-REIT Average Yield remained almost the same, but with an increase in Singapore Government Bond Yields from 1.84% to 2.37%, Yield Spread tightened.

The risk premium has dropped, but still remains attractive (compared to other asset classes) to accumulate Singapore REITs in stages to lock in the current price and to benefit from long-term yield after the recovery, especially since the S-REIT Market is still at a fair value. Moving forward, it is expected that DPU will continue to increase due to the recovery of the global economy, as seen in the previous few earning updates, especially for Hospitality REITs. NAV is expected to be adjusted upward due to revaluation of the portfolio.

Technically the FTSE ST REIT index has started a short term trend with the eye of the next crucial resistance at 890 to break. Breaking this resistance will wake up the bull for the Singapore REITs sector.

You can listen to my monthly REIT radio interview on MoneyFM89.3 here.

Note: This above analysis is for my own personal research and it is NOT a buy or sell recommendation. Investors who would like to leverage my extensive research and years of Singapore REIT investing experience can approach me separately for a REIT Portfolio Consultation.

Kenny Loh is an Associate Wealth Advisory Director  and REITs Specialist of Singapore’s top Independent Financial Advisor. He helps clients construct diversified portfolios consisting of different asset classes from REITs, Equities, Bonds, ETFs, Unit Trusts, Private Equity, Alternative Investments, Digital Assets and Fixed Maturity Funds to achieve an optimal risk adjusted return. Kenny is also a CERTIFIED FINANCIAL PLANNER, SGX Academy REIT Trainer, Certified IBF Trainer of Associate REIT Investment Advisor (ARIA) and also invited speaker of REITs Symposium and Invest Fair.  You can join my Telegram channel #REITirement – SREIT Singapore REIT Market Update and Retirement related news. https://t.me/REITirement

Continue ReadingSingapore REIT Monthly Update (April 3rd 2022)