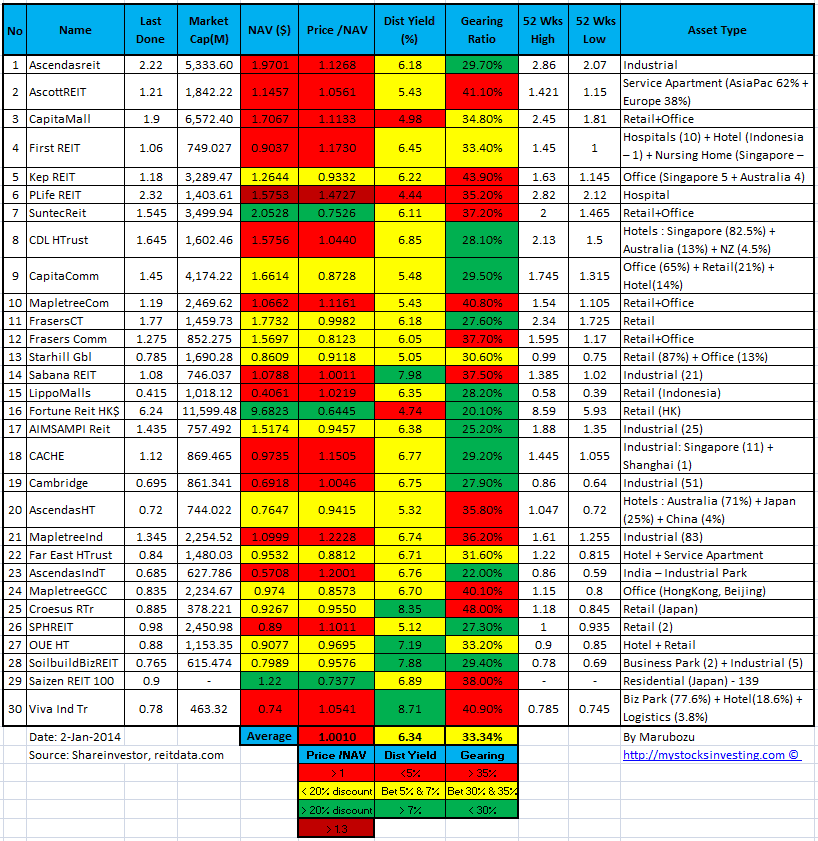
Singapore REIT Fundamental Analysis Comparison Table – 2 Jan 2014
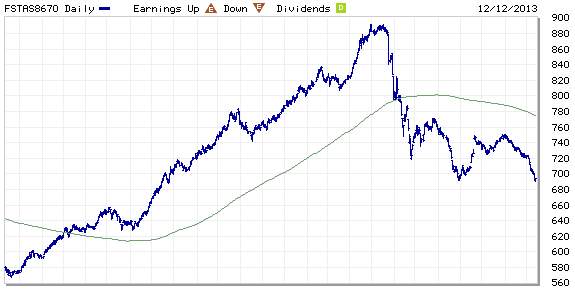
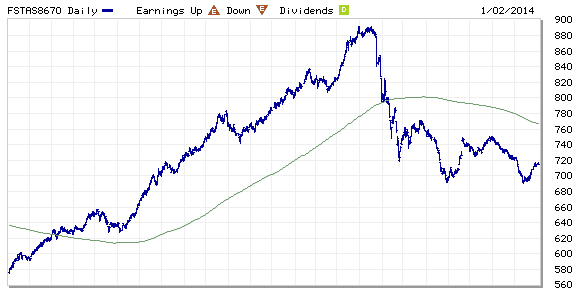
FTSE ST Real Estate Investment Trusts (FTSE ST REIT) Index changes from 693.59 to 714.92 compare to last post on Singapore REIT Fundamental Comparison Table on Dec 12, 2013. The index is trading below 200D SMA and technically bearish. The index will be facing resistance at about 730 during the recent rebound. Keep an eye on the Double Bottom formation on FTSE ST REIT Index Chart. This is a potential reversal pattern.
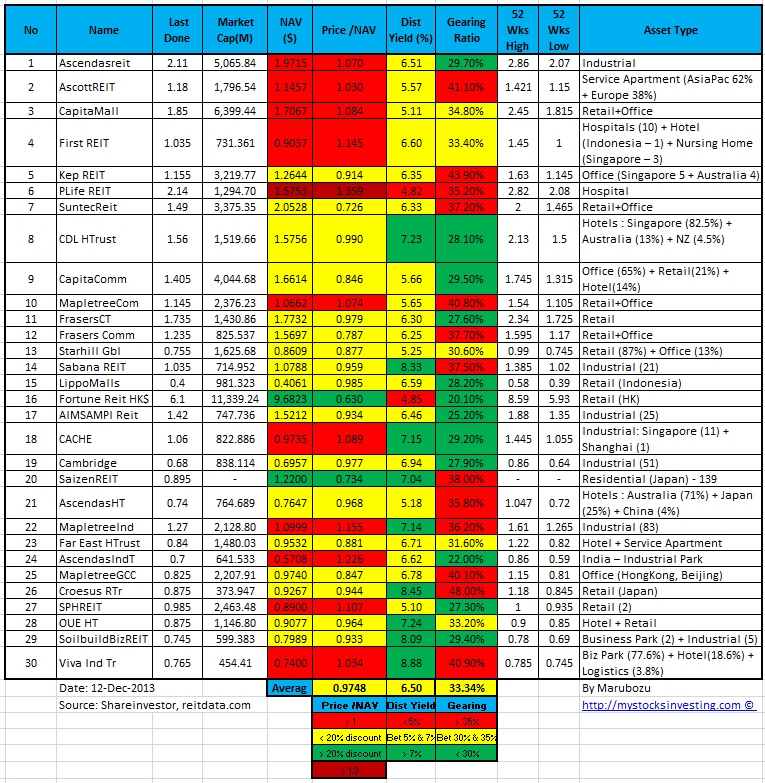
Compare to last Singapore REIT comparison table:
- Price/NAV increases from 0.9748 to 1.001.
- Dividend Yield decreases from 6.50% to 6.34%.
- Gearing Ratio remains at 33.34%.
- In general, most Singapore REIT is at fair value now and the distribution yield is reasonable. However technically Singapore REIT is in the bearish territory and going to drop further if the 690 support (FTSE ST REIT Index Chart) is broken. So don’t be ignorant to think this is the time to buy REIT yet as the price can drop further. The uncertainty in term of interest hike in near future remains high as Federal has started the QE tapering after a series of good economy data in US. Any hike in interest will affect the distribution income (reduction), NAV (value drops) and also the gearing ratio (increase) of the REIT. All of these will weaken the fundamental of the REIT and affect the REIT share price. If you are still holding REIT at the moment, you need to have a strong heart to handle the potential new drop in your REIT. Good Luck!
Find out how do I conduct research on Singapore REIT, how I color code and interpret those financial ratio in the comparison table, and why am I NOT touching any REIT at the moment although some REITs are undervalue. Find out WHERE and HOW to read the FTSE ST Real Estate Investment Trust Index because timing is very critical in making any investment decision. Check out my next public tutorial on “How to pick Singapore REIT for Dividend Investing” .