Singapore REIT Fundamental Analysis Comparison Table – 15 Mar 2015

  • Post author:

Singapore REIT list with Distribution Yield > 7%

  • AIMSAMP Cap REIT
  • Ascendas-hTrust
  • Cache Log Trust
  • Cambridge Ind Tr
  • Croesus RTrust
  • FHT
  • IREIT Global
  • Lippo Malls Trust
  • OUE Commercial REIT
  • OUE HTrust
  • Sabana REIT
  • Saizen REIT
  • SoilbuildBizREIT
  • Viva Ind Tr

Note:

  1. High Yield does not mean Good REIT
  2. Distribution Yield is based on past data. It is a lagging indicator. It cannot be used solely for investment decision making.

Singapore-REIT-Fundamental-Analysis-and-Comparison-Table-15-Mar-2015

Singapore REIT Bubble Charts for Value Pick & Risk Avoidance.


Continue ReadingSingapore REIT Fundamental Analysis Comparison Table – 15 Mar 2015

Singapore REIT Bubble Chart: What to Select & What to Avoid?

  • Post author:

Bubble chart derived from Mar 1 Singapore REITs Fundamental Comparison Table.

These Bubble Charts are used to show the “relative” position compare to other Singapore REITs.

Two visual bubble charts to pick and avoid:

  1. Undervalue Singapore REITs with High Distribution Yield (Value Pick)
  2. Overvalue Singapore REITs with High Gearing Ratio (Risk Avoidance)

See last Singapore REIT Bubble Charts here to see the relative movement.

Singapore REIT Bubble Chart (Value) Mar15-2015Singapore REIT Bubble Chart (Risk) Mar15-2015

Learn how to use this Bubble chart to select the right Singapore REIT for Dividend Investing.

Continue ReadingSingapore REIT Bubble Chart: What to Select & What to Avoid?

Singapore REIT Fundamental Analysis Comparison Table – 1 Mar 2015

  • Post author:

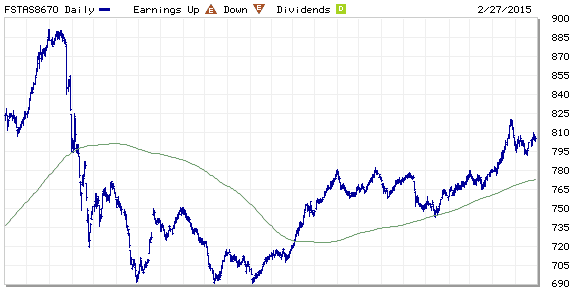
FTSE ST Real Estate Investment Trusts (FTSE ST REIT) Index increases from 796.8  to 805.26 compare to last post on Singapore REIT Fundamental Comparison Table on Feb 1, 2015. The index is continuing the uptrend after retraced to test 790-795 as support. Long term trend for Singapore REIT is bullish base on the chart pattern of this ST REIT index as the 200D SMA is trending up.

FTSE ST REIT Index Mar1-2015

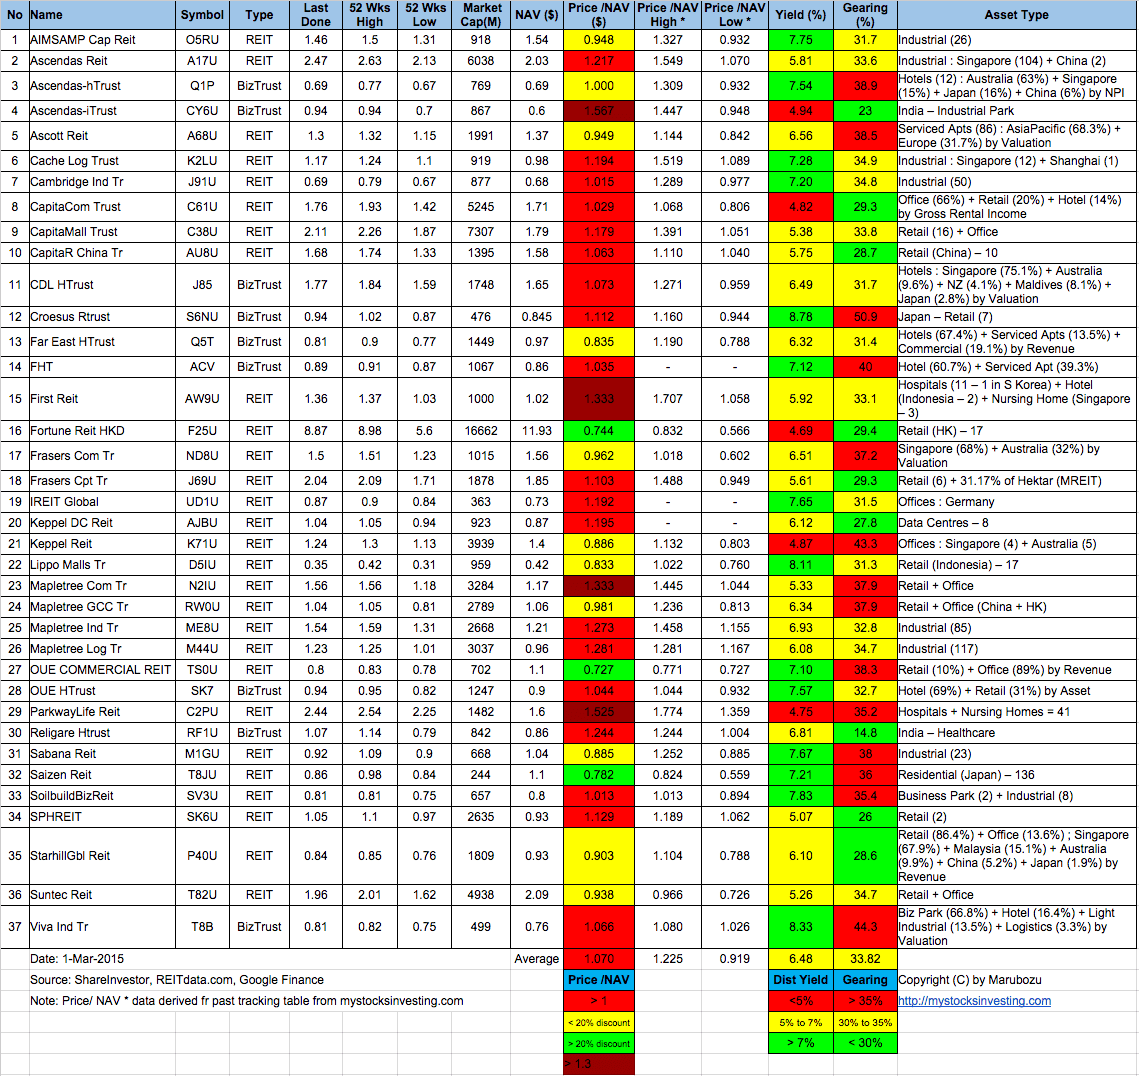
  • Price/NAV slight change from 1.05 to 1.07  (slightly over value now)
  • Distribution Yield decreases slightly from 6.52% to 6.48%.
  • Gearing Ratio increases slightly from 33.78% to 33.82%.

Singapore-REIT-Fundamental-Analysis-and-Comparison-Table-1-Mar-2015Singapore Interest Rate Mar1-2015

SIBOR Mar1-2015

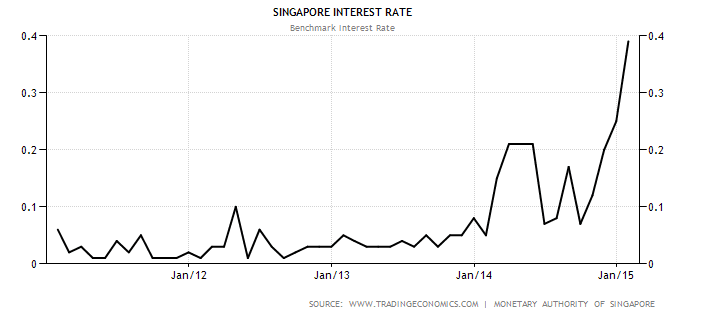
  • Singapore Interest Rate spikes to 0.39% (doubled compares to last month)
  • 1 month increases from 0.60302% to 0.61669%
  • 3 month increases from 0.66763% to 0.68138%
  • 6 month increases from 0.72915% to 0.74182%
  • 12 month increases from 0.85705% to 0.87509%

Singapore Interest Rate and SIBOR continue to rise. Not a good sign for REIT which have high gearing ratio because there may be increase in borrowing cost depends on the debt expiry profile.

There are a lot of analysis on how the interest rate hike can affect the REIT performance but technically the FTSE ST REIT Index is telling a different story. So, should the investor Buy more REIT (because the chart is showing an uptrend with some REIT gives very high distribution yield) or Sell to take profit (because interest rate is going to go up)? Totally confused on what to do? I will share my analysis and my view how to invest safely in this “confusing market condition” in my coming REIT class. Check out the very pragmatic and educational public seminar here “Investing in Singapore REIT“.

Grab an insight of the REIT class here 3 Tips To Increasing Returns On REITs Investments

Continue ReadingSingapore REIT Fundamental Analysis Comparison Table – 1 Mar 2015