Are You Ready to Short Singapore REIT?
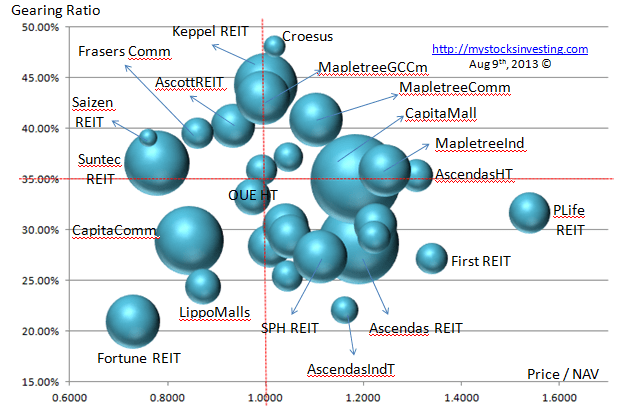
Looks for those Singapore REITs with High Gearing and Overvalue. Bet on Right issuing!
Good luck and have fun shorting! Disclaimer applied!
See Singapore REIT Fundamental Analysis Comparison table here.
Looks for those Singapore REITs with High Gearing and Overvalue. Bet on Right issuing!
Good luck and have fun shorting! Disclaimer applied!
See Singapore REIT Fundamental Analysis Comparison table here.
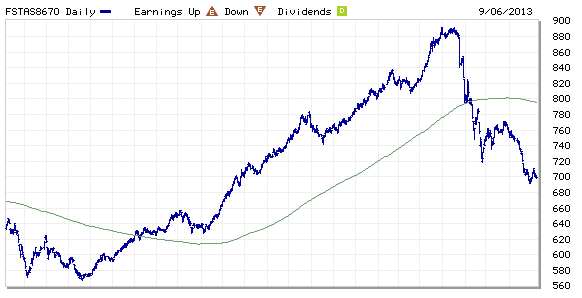
FTSE ST Real Estate Investment Trusts (FTSE ST REIT) Index rebounded to 767.53 on July 26, 2013. However the index is trading below 200D SMA and technically bearish. Resistance at about 800.
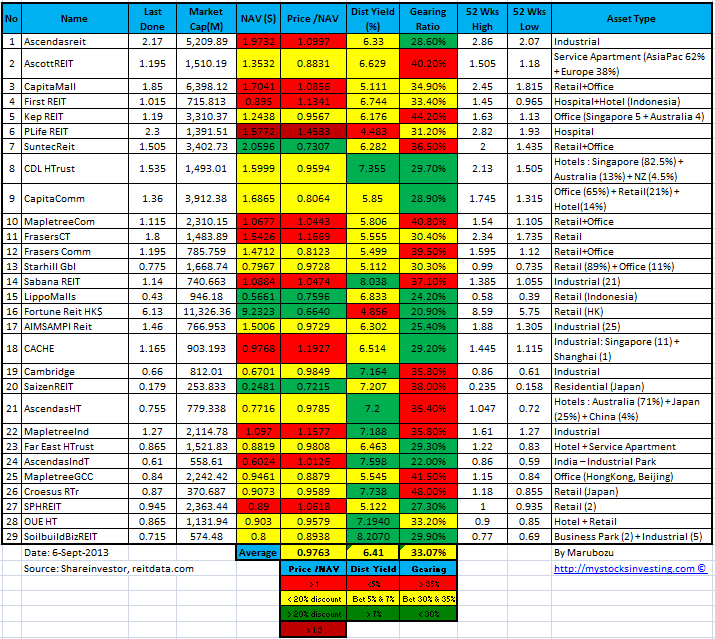
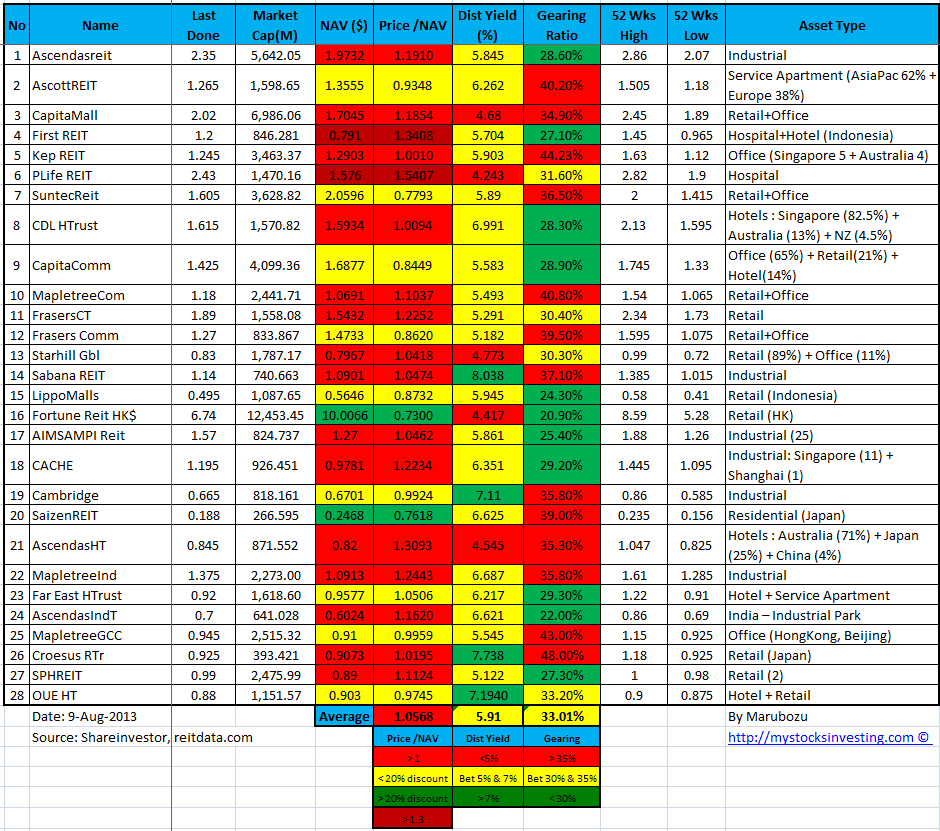
Compare to last month SREIT comparison table:
Note: Added SPH REIT & OUE Hospitality Trust.
I prepare this Singapore REIT comparison one week earlier because I am preparing for the REIT class course material. If you are interested to learn how I do research on Singapore REIT and also time the entry / exit by learning the simple Trend Analysis, you may want to check out my next public tutorial “How to pick Singapore REIT for Dividend Investing” .
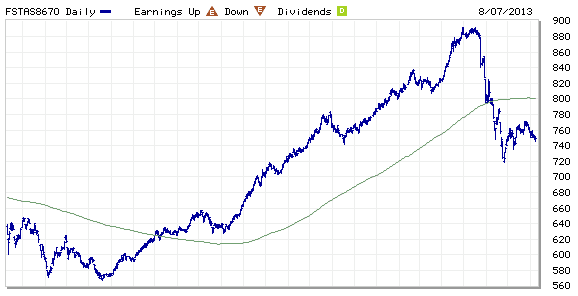
Singapore REIT has been beaten down badly for about 15% from the recent peak. See below chart of FTSE ST-REIT Index. The index is currently trading below 200D SMA (about 800) and the 200D SMA is trading flat.
So, are the Singapore REITs cheap now? Is it the right time to pick up some REITs with high distribution yield? I am not going to tell you the answer because I am not the certified analyst and brokers and unable to make any Buy or Sell recommendation. I am going to put up all the facts and charts here for reference to give me an overview of current situation for my investing decision making.
See Singapore REIT comparison tables for Fundamental Analysis. In general, most of Singapore REITs are still over value. Let’s look at the charts of some Singapore REITs with large market capitalization.
CapitaMall (S$7.02B, S$2.03)
Ascendas REIT (S$5.52B, S$2.30)
CapitaComm (S$4.2B, S$1.465)
Suntec REIT (S$3.54B, S$1.57)
Keppel REIT (S$3.49B, S$1.30)
MapletreeCom (S$2.53B, S$1.225)
PLife REIT (S$1.47B, S$2.43)
In Summary base on the above charts, clearly the REITs are NOT trading in an uptrend. Some of them have broken 200D SMA and the charts are technically bearish. This means that the REIT prices can go even lower despite the current distribution yield looks attractive.
Check out How to Combine Fundamental & Technical Analysis to analyse Singapore REIT here.