Invest in Orchard Road, Singapore, with S-REITs!
Orchard Road is home to familiar names such as Takashimaya, Paragon, Plaza Singapura, 313@Somerset. But with S-REITs, you can invest in a part of Singapore’s largest retail district.

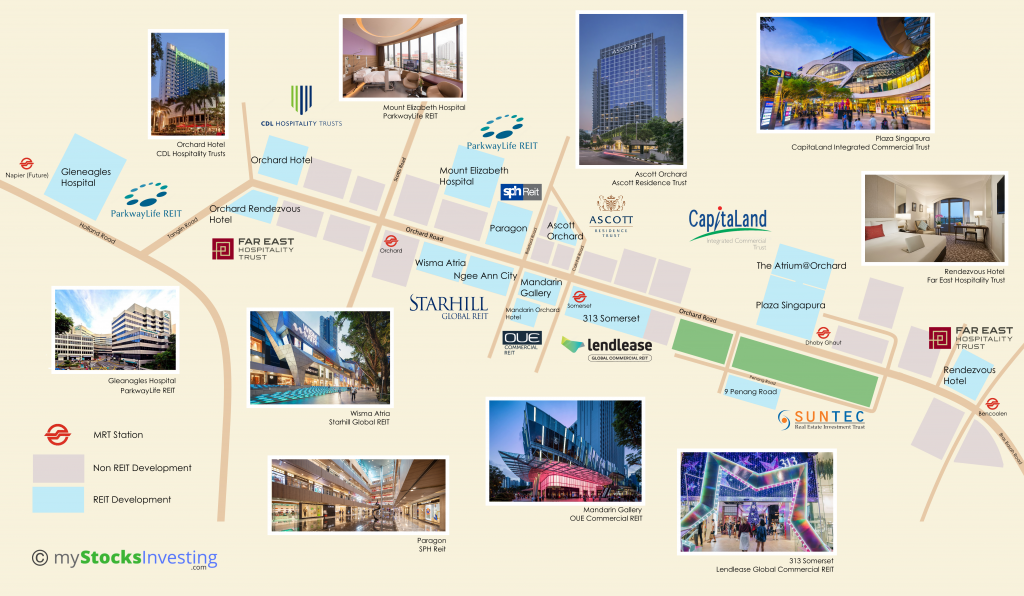
Retail is not the only REIT sector along Orchard Road. Despite mostly having a Retail REIT presence, there are also several other REIT sectors, such as hospitality and office REITs in the vicinity. Below are some of the REITs found in Orchard Road, with a handy diagram on where they are located within the shopping district. Property valuation figures are accessed via the REIT’s website as of 5th Februrary 2021.
Retail/Integrated Developments
Located next to Dhoby Ghaut MRT, Capitaland Integrated Commercial Trust, Singapore’s largest REIT by market capitalisation, has portfolios consisting of both The Atrium@Orchard and Plaza Singapura along Orchard Road. With large tenants such as Spotlight and Golden Village, both properties have a total property valuation of S$2.04 billion.

Starhill Global’s portfolio includes Wisma Atria and Ngee Ann City along Orchard Road. Both are integrated Retail and Office developments, including anchor tenants such as Takashimaya Department Store. Located next to Orchard MRT, they have a combined property valuation of S$2.062 billion.

Located right above Somerset MRT, 313@Somerset is Lendlease Global Commercial REIT’s presence in Orchard Road. 313@Somerset includes many fashion tenants such Love Bonito, ZARA, FOREVER 21, Cotton On and The Editor’s Market etc. It has a property valuation of S$1.008 billion.

OUE Commercial REIT has 2 properties along Orchard Road, namely Mandarin Gallery and Mandarin Orchard Hotel. Mandarin Gallery specialises in high-end retail with many brands such as Bathing Ape and HUGO BOSS, while Mandarin Orchard Hotel is an upscale hotel with 1,077 rooms. Both have a combined portfolio valuation of S$1.721 billion.

Paragon is a premier upscale mall, specialising in high end retail and fashion. Paragon also houses Paragon Medical, which hosts approximately 90 medical and dental specialist clinics and offices.
Office

The newest property included within this article, 9 Penang Road is a newly completed Grade A commercial building. The ten-storey development consists of two towers with office space across eight floors and retail space at the first level. It has a property valuation of S$276.0 million.
Hospitality
Located behind Knightsbridge Mall (or more easily known as the mall with Apple Store Orchard), Ascott Orchard is a serviced residence consisting of 220 suites comprising studios to two-bedroom units and penthouses. It has a property valuation of $413 million.

Far East Hospitality Trust’s portfolio consists of 2 hotels, Orchard Rendezvous Hotel at the western end and Rendezvous Hotel at the eastern end of Orchard Road. Combined, there are 686 guest rooms between the 2 hotels, with a property valuation of S$715.3 million.

Located opposite Orchard Rendezvous Hotel, Orchard Hotel has 656 guest rooms. Adjacent to Orchard Hotel is Claymore Connect, a small lifestyle mall. Both properties have a combined property valuation of S$466.0 million.
Healthcare

ParkwayLife REIT has 2 hospitals, one within Orchard (Mount Elizabeth Hospital) and one in the nearby Tanglin area (Gleneagles Hospital). Gleneagles Hospital consists of 257 beds while Mount Elizabeth Hospital has 345 beds. They have a combined total property valuation of S$1.143 billion.
Below is map which highlights the approximate location of each of the properties listed above, including several landmarks such as MRT stations. The map is not drawn to scale.
Portfolio Information is just one of the fundamentals to look at when choosing which REITs to invest in. One of which is gearing ratio (leverage ratio). Yield and lease management of REITs are also factors to consider. For example, a property located along Orchard Road (good location) but with low occupancy rates (bad) is not necessarily good.
By investing in one of the above REITs, you will be investing in the REIT as a whole. For example, by investing in Suntec REIT, you will not just be investing in 9 Penang Road, but Suntec City Mall and Office Towers too.
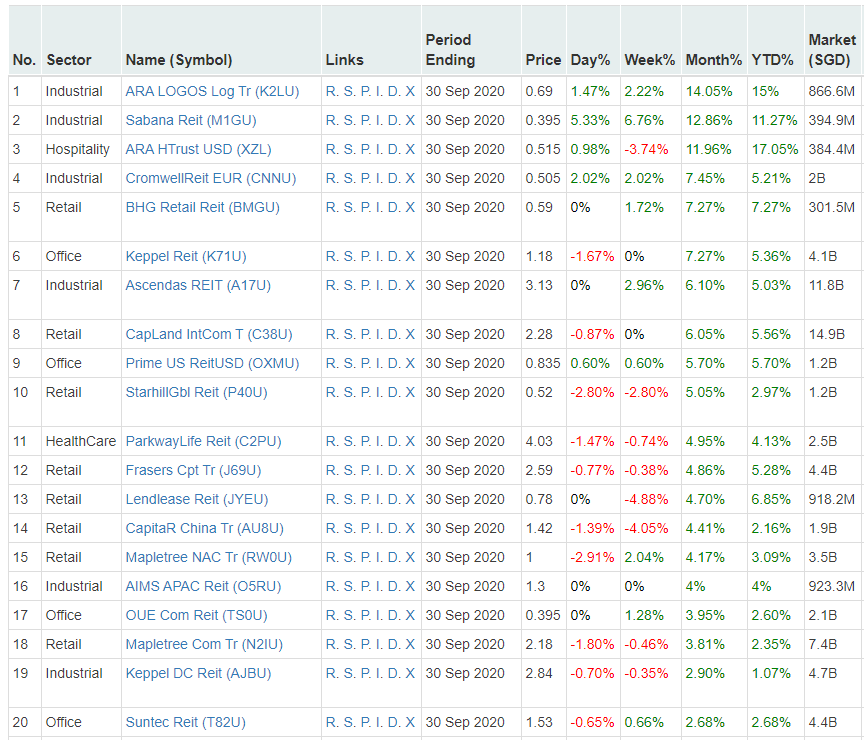
In the following, using the StocksCafe REIT screener (free version), we can compare the Market Capitalisations, Yield (trailing twelve months) and Gearing Ratios for each of the REITs listed above.

The above table shows the 10 S-REITs, sorted by market capitalisation in descending order. For yield, the value is calculated using the trailing twelve months distribution per unit (DPU) data. Therefore it may be lower than usual due to dividend cuts brought about by the Covid-19 pandemic. Gearing is simply the percentage of total debt/total equity.
For more detailed and regularly updated information for each of the REITs, do try out and subscribe to the comprehensive StocksCafe REIT Screener. At ~$8.40 per month (current early bird promotion with a yearly subscription), get access to much more information such as occupancy rates, debt information, interest coverage ratio etc. for each REIT. You can try out the features here.