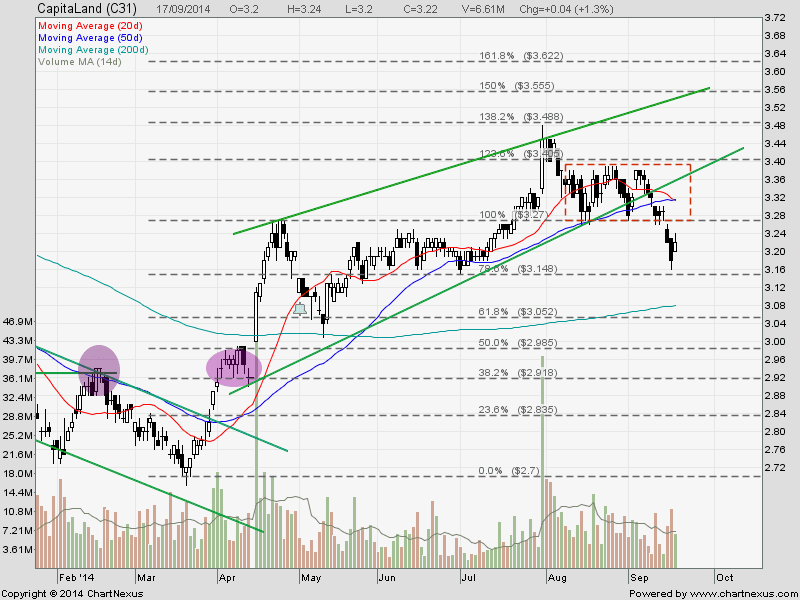
Capitaland: Up Trend Ended
Capitaland up trend has ended after breaking the Rising Wedge support and breakout from Rectangle pattern. Currently Capitaland may rebound after forming Bullish Harami candlesticks. It is important to see whether $3.27 becomes a Support Turned Resistance level. Also take note that 50D SMA used to be a reliable support or resistance for Capitaland base on historical pattern.
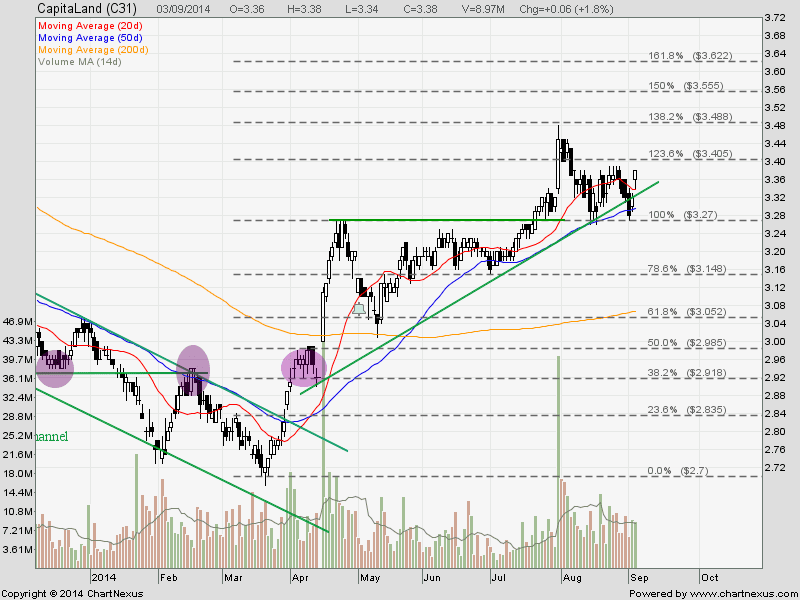
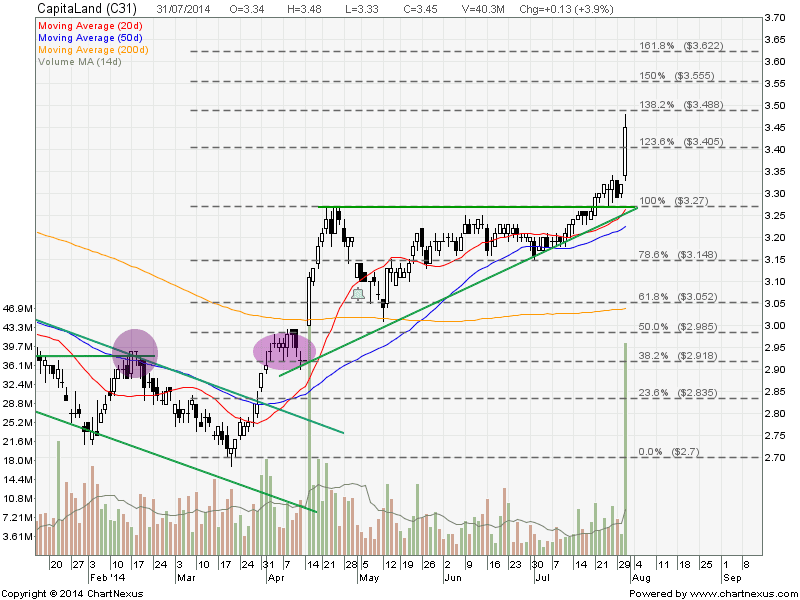
Previous stock chart analysis of Capitaland can be found here.