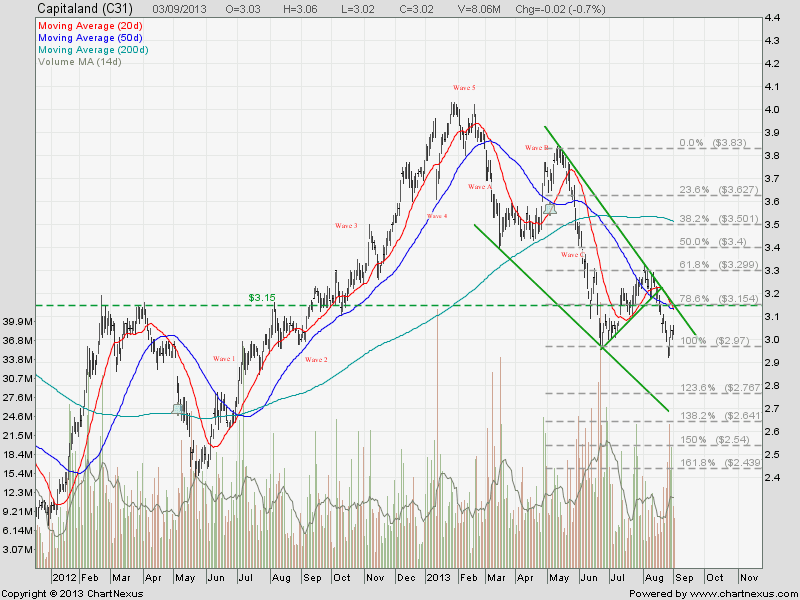
Capitaland: Falling Wedge
Capitaland is currently trading in a Falling Wedge. Resistance at $3.15 and support is at $3.00. Long term price target base on Fibonacci Expansion, Capitaland may reach the 161.8% Fibonacci Retracement Level at about $2.44. Technically the chart is bearish and good for shorting when the rebound is exhausted.
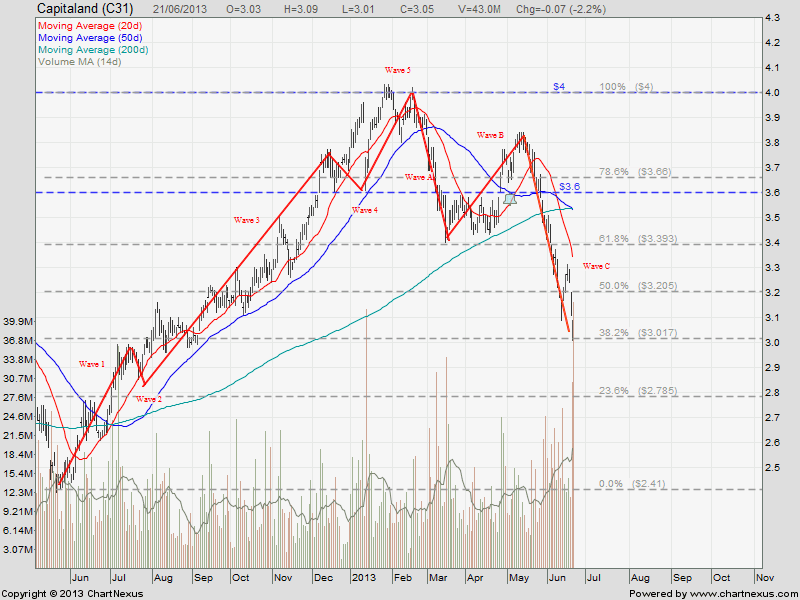
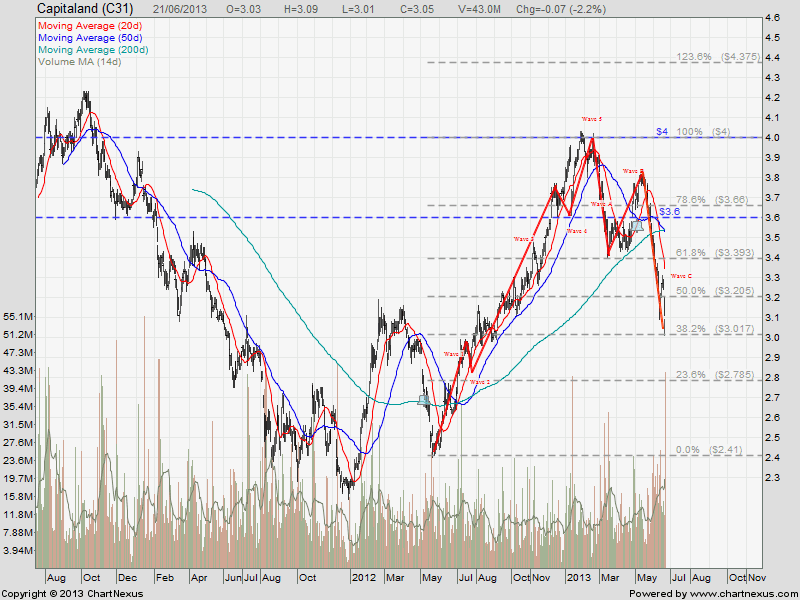
See previous analysis on Capitaland: Elliott Wave.