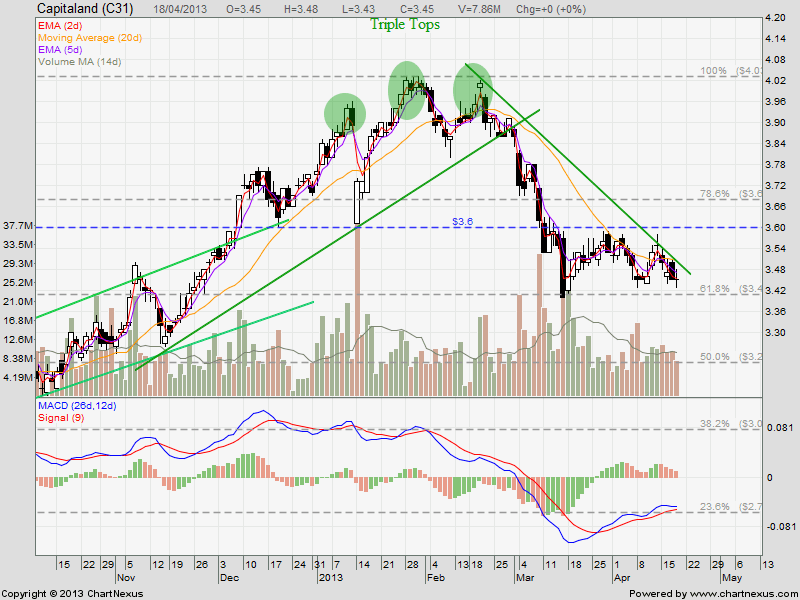
Capitaland: Range Bound But Watch $3.40!
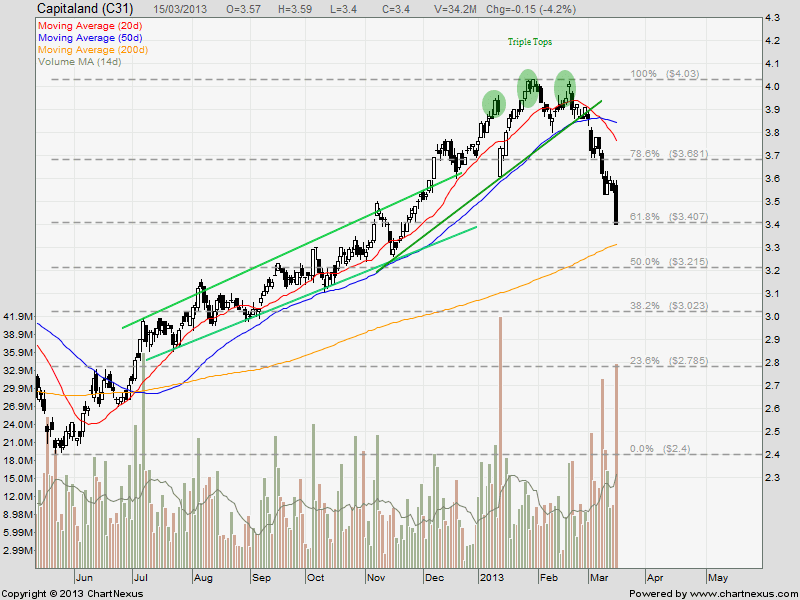
Capitaland is currently trading within a range between $3.40 and $3.60. Key support to watch is $3.40. Breaking this support will form a “Lower Low, Lower High” bearish chart pattern. 200D SMA is about $3.40. In addition, this is also the 61.8% FR level.
In addition, breaking this support will start a Wave C. See previous Elliott Wave pattern on Capitaland here.
Keep a BIG eye on this level!