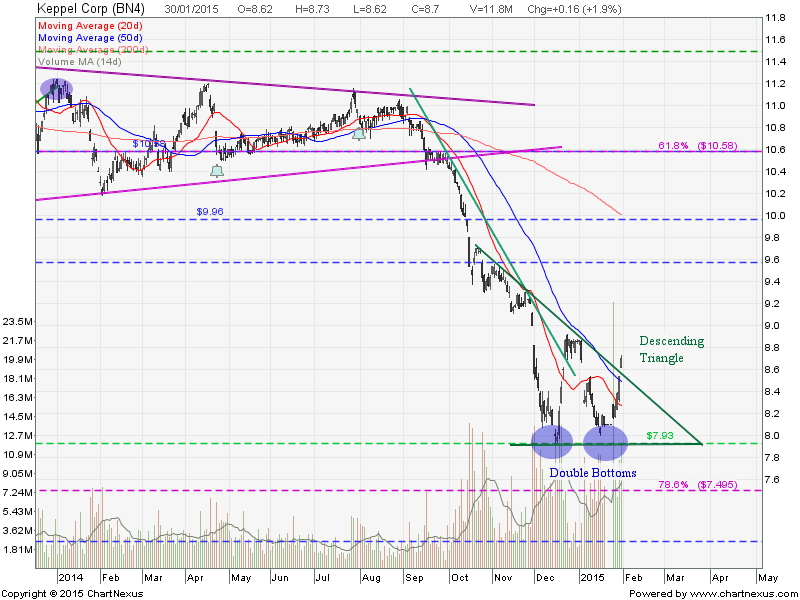
KepCorp: Rejected at 200D SMA Resistance
KepCorp share price is rejected at 200D SMA Resistance after breaking out from the Double Bottoms. Is this only a Dead Cat Bounce before continuing the down trend for Kep Corp? Keep a close eye on the support zone between $8.90 and $9.00.

Original post by Marubozu My Stocks Investing Journey.
| Current P/E Ratio (ttm) | 8.8179 |
|---|---|
| Estimated P/E(12/2015) | 10.3700 |
| Relative P/E vs. FSSTI | 0.6222 |
| Earnings Per Share (SGD) (ttm) | 1.0490 |
| Est. EPS (SGD) (12/2015) | 0.8920 |
| Est. PEG Ratio | 10.8814 |
| Market Cap (M SGD) | 16,760.64 |
| Shares Outstanding (M) | 1,811.96 |
| 30 Day Average Volume | 4,629,987 |
| Price/Book (mrq) | 1.5486 |
| Price/Sale (ttm) | 1.2816 |
| Dividend Indicated Gross Yield | 5.19% |
| Cash Dividend (SGD) | 0.3600 |
| Dividend Ex-Date | 04/22/2015 |
| 5 Year Dividend Growth | 5.12% |
| Next Earnings Announcement | 07/24/2015 |
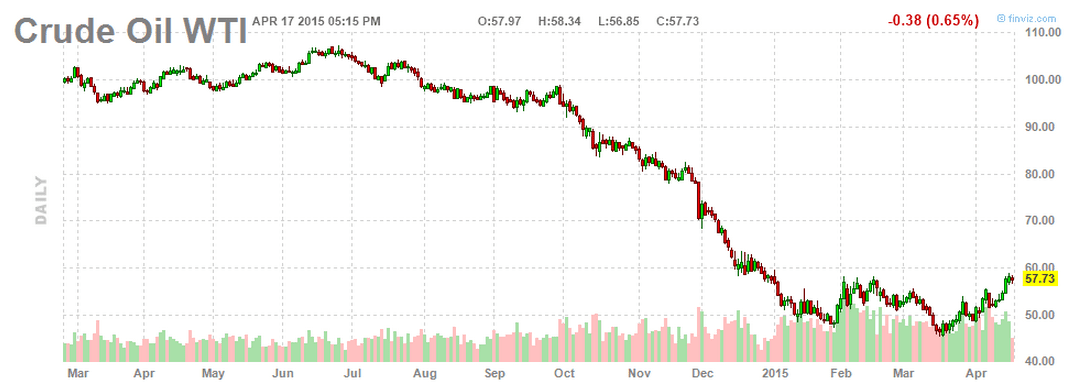
Another thing to watch is the Crude Oil stock chart. Crude Oil is currently showing a Double Bottom, a trend reversal chart pattern, but testing the neckline resistance.