
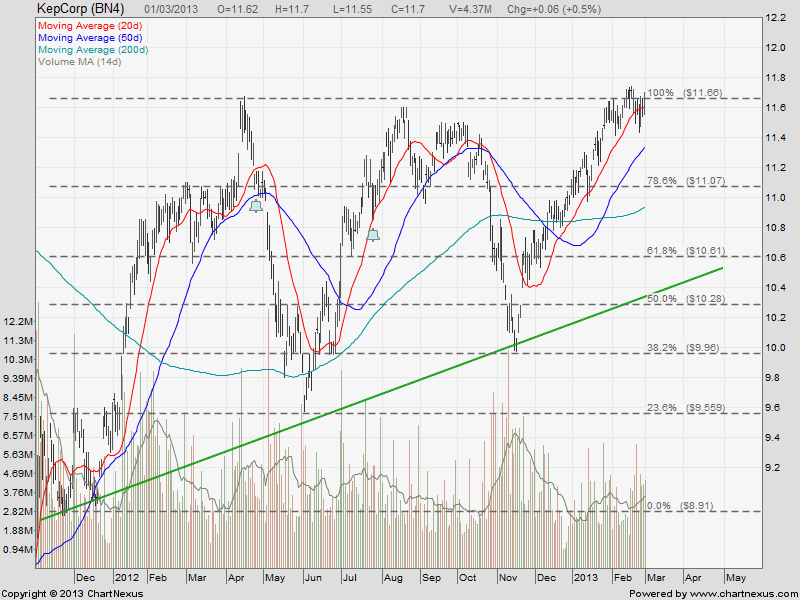
KepCorp: At 20 Months High
Keppel Corp is currently trading at 20 months high facing resistance at about $11.70. The downside risk is more higher than upside potential at the moment. Good opportunity to short if KepCorp break the recent low of $11.44.
Key Statistics for KEP
| Current P/E Ratio (ttm) | 9.3750 |
|---|---|
| Estimated P/E(12/2013) | 13.2054 |
| Relative P/E vs. FSSTI | 0.8849 |
| Earnings Per Share (SGD) (ttm) | 1.2480 |
| Est. EPS (SGD) (12/2013) | 0.8860 |
| Est. PEG Ratio | 1.6055 |
| Market Cap (M SGD) | 21,042.21 |
| Shares Outstanding (M) | 1,798.48 |
| 30 Day Average Volume | 3,453,067 |
| Price/Book (mrq) | 2.2747 |
| Price/Sale (ttm) | 1.5020 |
| Dividend Indicated Gross Yield | 3.85% |
| Cash Dividend (SGD) | 0.2700 |
| Last Dividend | 04/24/2013 |
| 5 Year Dividend Growth | 25.92% |
| Next Earnings Announcement | 04/19/2013 |

 Week 25_2011 - Week 22_2012")
 7_30_2011 - 5_27_2012")