OCBC Bank: Break Resistance!

  • Post author:

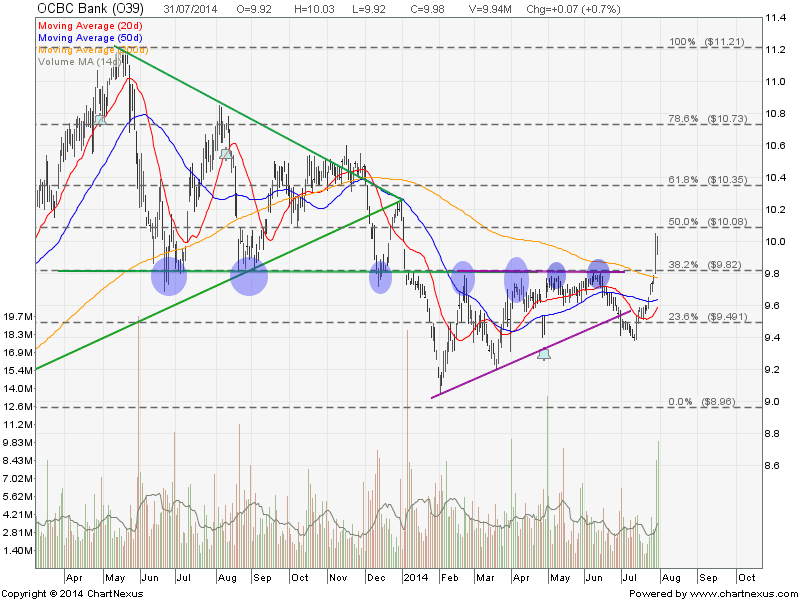
OCBC breaks the tough support turned resistance at about $9.82 and currently testing a psychological $10.00 resistance. If OCBC can stay above $9.82, it is a confirmed that OCBC will start an uptrend.

2014July31-OCBC Bk-800x600

Original post by Marubozu from My Stocks Investing Journey.

Current P/E Ratio (ttm) 11.8810
Estimated P/E(12/2014) 11.5376
Relative P/E vs. FSSTI 0.8335
Earnings Per Share (SGD) (ttm) 0.8400
Est. EPS (SGD) (12/2014) 0.8650
Est. PEG Ratio
Market Cap (M SGD) 34,857.21
Shares Outstanding (M) 3,492.71
30 Day Average Volume 3,041,567
Price/Book (mrq) 1.3163
Price/Sale (ttm) 3.8098
Dividend Indicated Gross Yield 3.41%
Cash Dividend (SGD) 0.1700
Dividend Ex-Date 04/28/2014
5 Year Dividend Growth 3.96%
Next Earnings Announcement 08/05/2014
Continue ReadingOCBC Bank: Break Resistance!

OCBC Bank: Get Ready for the Reversal

  • Post author:

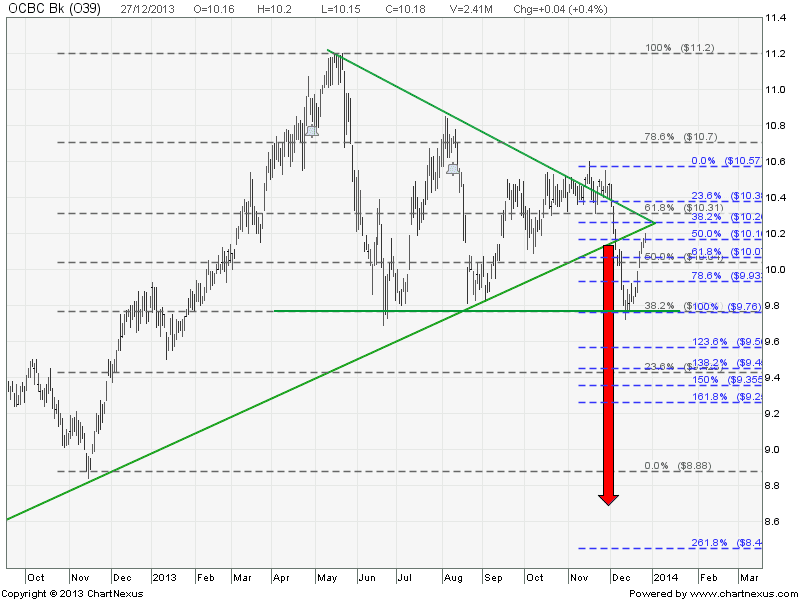
OCBC Bank has rebounded strongly after forming a Hammer at the Support. See previous analysis here. This Santa Claus Rally probably will continue for one more week with potential Window Dressing and Portfolio Pumping by the Fund Managers. So, watch for reversal candles when OCBC Bank get close to about $10.26 and $10.30. If the reversal does happen, the Symmetrical Triangle support will become resistance to confirm the successful breakout with price target of $8.70.

2013Dec27-OCBC Bk-800x600

Current P/E Ratio (ttm) 13.4834
Estimated P/E(12/2013) 13.2208
Relative P/E vs. FSSTI 1.0052
Earnings Per Share (SGD) (ttm) 0.7550
Est. EPS (SGD) (12/2013) 0.7700
Est. PEG Ratio 2.2156
Market Cap (M SGD) 34,944.94
Shares Outstanding (M) 3,432.71
30 Day Average Volume 3,590,167
Price/Book (mrq) 1.5837
Price/Sale (ttm) 4.1590
Dividend Indicated Gross Yield 3.34%
Cash Dividend (SGD) 0.1700
Dividend Ex-Date 08/12/2013
5 Year Dividend Growth 3.96%
Next Earnings Announcement 02/14/2014
Continue ReadingOCBC Bank: Get Ready for the Reversal

OCBC: Hammer at Support!

  • Post author:

OCBC formed a hammer at 38.2% (61.8%) Fibonacci support with a confirmation candle. RSI is oversold. My Technical Analysis class students should know what does it mean. Draw a 0%-100%-61.8% Fibonacci Level to derive the price target of this retracement.

Take note that OCBC has just started a new down trend after breaking down from a Symmetrical Triangle. There may be a swing trade opportunity if a down trend channel is formed. Price target of this Symmetrical Triangle breakout is $8.85. Good luck!

Original post by Marubozu My Stock Investing Journey

2013Dec13-OCBC Bk-800x600

Continue ReadingOCBC: Hammer at Support!