OCBC Bank: Rebound!

  • Post author:

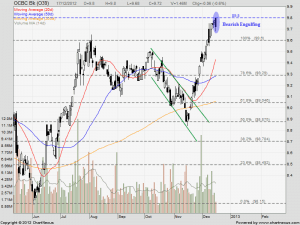
OCBC Bank rebounded from 200D SMA (also the $9.00 psychological support) and 61.8% Fibonacci Retracement Level today. Two reversal candlesticks pattern – Matching Low & Long Dawn Line were formed to confirm the trend reversal. Opportunity for a short Bullish Trade. Immediate resistance is $9.29 followed by $9.60.


Key Statistics for OCBC

Current P/E Ratio (ttm) 12.4829
Estimated P/E(12/2012) 11.0437
Relative P/E vs.FSSTI 1.0204
Earnings Per Share (SGD) (ttm) 0.7290
Est. EPS (SGD) (12/2012) 0.8240
Est. PEG Ratio 1.4250
Market Cap (M SGD) 31,215.15
Shares Outstanding (M) 3,430.24
30 Day Average Volume 2,986,333
Price/Book (mrq) 1.3199
Price/Sale (ttm) 3.8019
Dividend Indicated Gross Yield 3.41%
Cash Dividend (SGD) 0.1600
Last Dividend 08/08/2012
5 Year Dividend Growth 3.58%
Next Earnings Announcement 11/08/2012
Continue ReadingOCBC Bank: Rebound!