Parkway Life REIT: Good for Passive Income Investing?

  • Post author:

Parkway Life REIT Logo

Parkway Life REIT 3Q 2015 Investor Presentation on Nov 5, 2015

  • Last Done Price = $2.31
  • Market Cap = $1.398 B
  • NAV = $1.66
  • Price /  NAV = 1.375 (37.5% Premium)
  • Price / NAV (High) = 1.77
  • Price / NAV (Low) = 1.33
  • Distribution Yield (includes Divestment Gain) = 5.818%
  • Gearing Ratio = 35.8%
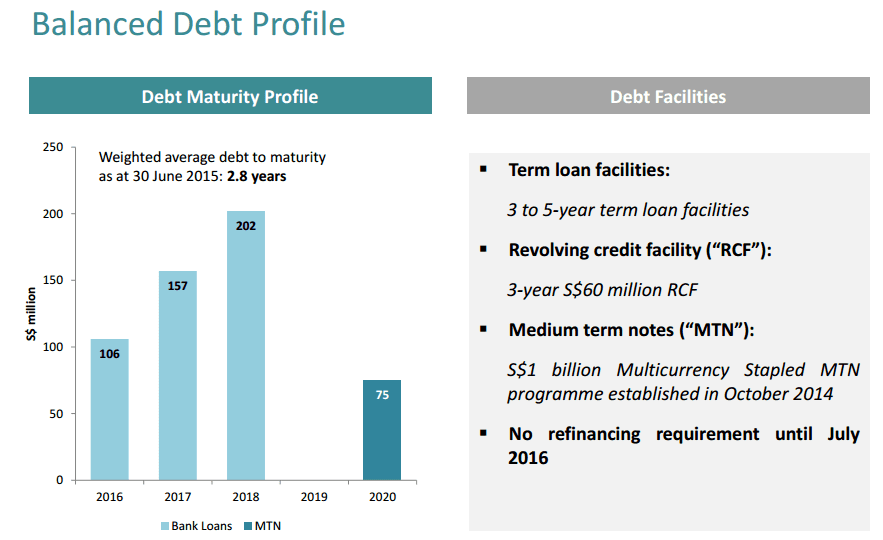
  • WADM = 3.7 Years
  • WALE = 9.39 Years

Singapore REITs Fundamental Analysis Comparison Table

Parkway Life REIT Distribution Growth History Nov7-2015Parkway Life REIT Japan Portfolio Nov7-2015 Parkway Life REIT Japan1 Portfolio Nov7-2015 Parkway Life REIT Malaysia Portfolio Nov7-2015 Parkway Life REIT Singapore Portfolio Nov7-2015Parkway Life REIT WADM Nov7-2015


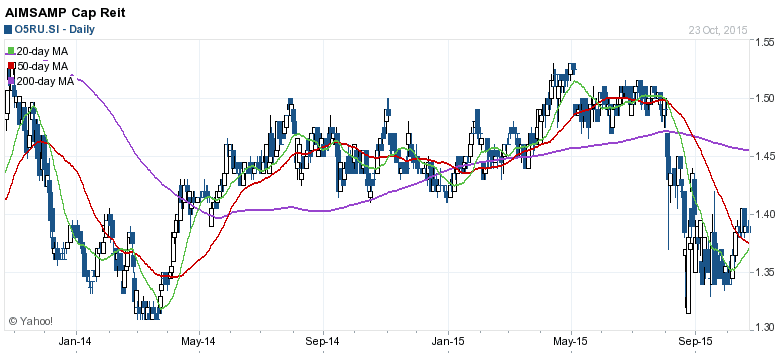
Parkway Life REIT Technical Analysis & Stock Chart

PLife REIT Nov7-2015

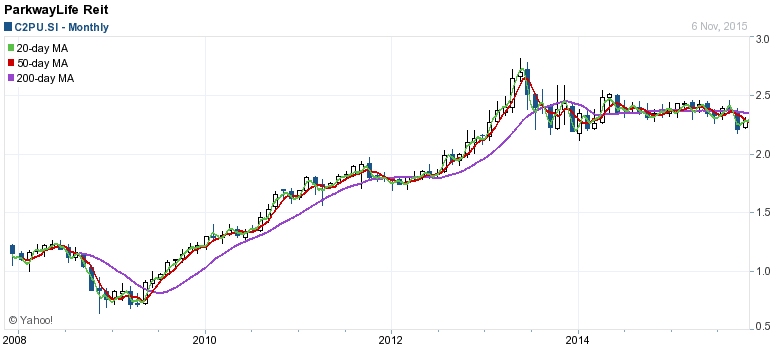
Parkway Life REIT is currently moving side way with limited upside potential base on the valuation (already 37.5% overvalue) and distribution yield below 6%. The yield is lower after fully payout of the divestment gain in next quarter.

FIRST REIT is another healthcare REIT to compare with Parkway Life REIT. Do you Due Diligence to compare the Fundamental of both healthcare REIT for Passive Income Investing. Healthcare REIT is defensive in nature and should be included into retail investors’ portfolio as the distribution income is more sustainable and predictable. However, it is important to know the entry price and entry timing otherwise we will lose out our initial invested capital.

Check out Singapore REIT Course here on how analyse the fundamental and dividend sustainability of Singapore Healthcare REIT.  https://mystocksinvesting.com/course/singapore-reits-investing/

Continue ReadingParkway Life REIT: Good for Passive Income Investing?

AIMS AMP Capital Industrial REIT Fundamental & Technical Analysis

  • Post author:

AIMS AMP Capital Industrial REIT Logo

AIMS AMP Capital Industrial REIT – July 29 2015

  • Last Done Price = $1.39
  • Market Cap = $881.6 M
  • NAV = $1.52
  • Price /  NAV = 0.914 (9% Discount)
  • Price / NAV (High) = 1.33
  • Price / NAV (Low) = 0.88
  • Distribution Yield (TTM) = 7.91%
  • Gearing Ratio = 31.2%
  • WADM = 2.9 Years
  • WALE = 3.11 Years
  • Occupancy Rate = 96.1%

Singapore REITs Fundamental Analysis Comparison Table

AIMS AMP Capital Industrial REIT DPU History Oct25-2015AIMS AMP Capital Industrial REIT Map Assets Oct25-2015 AIMS AMP Capital Industrial REIT Map Assets1 Oct25-2015AIMS AMP Capital Industrial REIT Portfolio Oct25-2015AIMS AMP Capital Industrial REIT Diversification Oct25-2015 AIMS AMP Capital Industrial REIT Tenants Profile Oct25-2015AIMS AMP Capital Industrial REIT WADM Oct25-2015 AIMS AMP Capital Industrial REIT WALE Oct25-2015AIMS AMP Capital Industrial REIT Occupancy Oct25-2015

AIMS AMP Cap Industrial REIT Technical Analysis & Stock Chart

AIMS AMP Capital Industrial REIT Stock Chart Oct25-2015

AIMS AMP Cap Industrial REIT is currently trading below 200D SMA and currently on short term rebound and facing the $1.40 resistance. Medium term and long term trend remain down.

AIMS AMP Cap Industrial REIT can be alternate consideration to Ascendes REIT and Mapletree Industrial Trust.

Check out Singapore REIT Course here on how analyse the fundamental and dividend sustainability of Singapore Industrial REIT.  https://mystocksinvesting.com/course/singapore-reits-investing/

Continue ReadingAIMS AMP Capital Industrial REIT Fundamental & Technical Analysis

Ascendes Hospitality Trust – What are the Risks?

  • Post author:

Ascendes Hospitality Trust – Aug 6 2015

  • Last Done Price = $0.67
  • Market Cap = $747.9 M
  • NAV = $0.71
  • Price /  NAV = 0.9436 (15% Discount)
  • Price / NAV (High) = 1.31
  • Price / NAV (Low) = 0.85
  • Distribution Yield (TTM) = 7.64%
  • Gearing Ratio = 38%
  • WADM = 2.8 Years

Singapore REITs Fundamental Analysis Comparison Table

Ascendes H Trust Portfolio Oct25-2015Ascendes H Trust Distribution History Oct25-2015Ascendes H Trust WADM Oct25-2015Ascendes H Trust Debt Currency Oct25-2015


Ascendes Hospitality Trust (a-H Trust)Technical Analysis & Stock Chart

Ascendes H Trust Stock Chart Oct25-2015


Ascendes Hospitality Trust (FHT) is currently trading below 200D SMA and currently on short term rebound and facing the 20D SMA resistance. Medium term and long term trend remain down.

As Ascendes Hospitality Trust major portfolio in Australia, China & Japan, there is huge exposure to currency risks. You must also be a very good Forex trader if you want to own this A H-Trust.

Check out Singapore REIT Course here on how to time the entry and analyse the fundamental and dividend sustainability of Singapore REIT.  https://mystocksinvesting.com/course/singapore-reits-investing/

Continue ReadingAscendes Hospitality Trust – What are the Risks?